Fig. 9.
Download original image
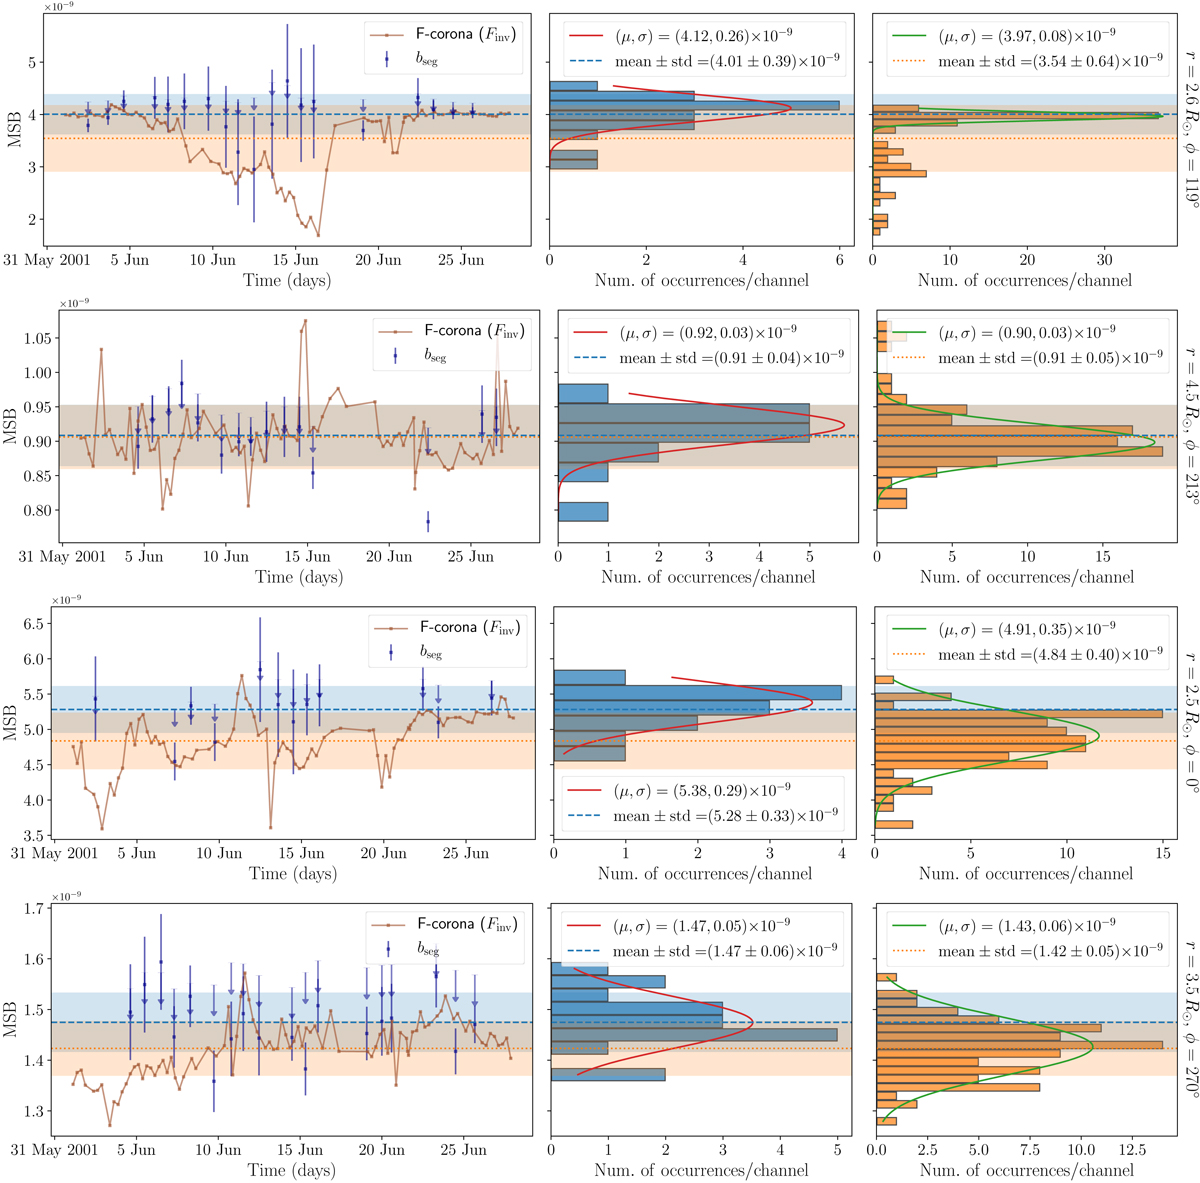
Distribution of bseg values (blue) and that of the F-corona intensity Finv (orange) measured in different pixels in June 2001. The four rows correspond to pixels at r = 2.6 R⊙ and ϕ = 119°, r = 4.5 R⊙ and ϕ = 213°, r = 2.5 R⊙ and ϕ = 0°, and r = 3.5 R⊙ and ϕ = 270° (from top to bottom). Finv is calculated using the inversion method. Left column: evolution of both quantities. Mid and right columns: histogram of the bseg and Finv distributions, respectively. In all panels, the y-axis is in the MSB units. The red and green solid lines show the Gaussian fits of the bseg and Finv distributions, respectively. The mean and standard deviation of these distributions are shown by means of the blue dashed and orange dotted lines with the corresponding shaded area, respectively. The upper limit of the F-corona intensity and the estimate of its systematic uncertainty inferred from the correlation method are shown for each segment as the blue arrow and the error bar, respectively (see text for details).
Current usage metrics show cumulative count of Article Views (full-text article views including HTML views, PDF and ePub downloads, according to the available data) and Abstracts Views on Vision4Press platform.
Data correspond to usage on the plateform after 2015. The current usage metrics is available 48-96 hours after online publication and is updated daily on week days.
Initial download of the metrics may take a while.