Fig. 6.
Download original image
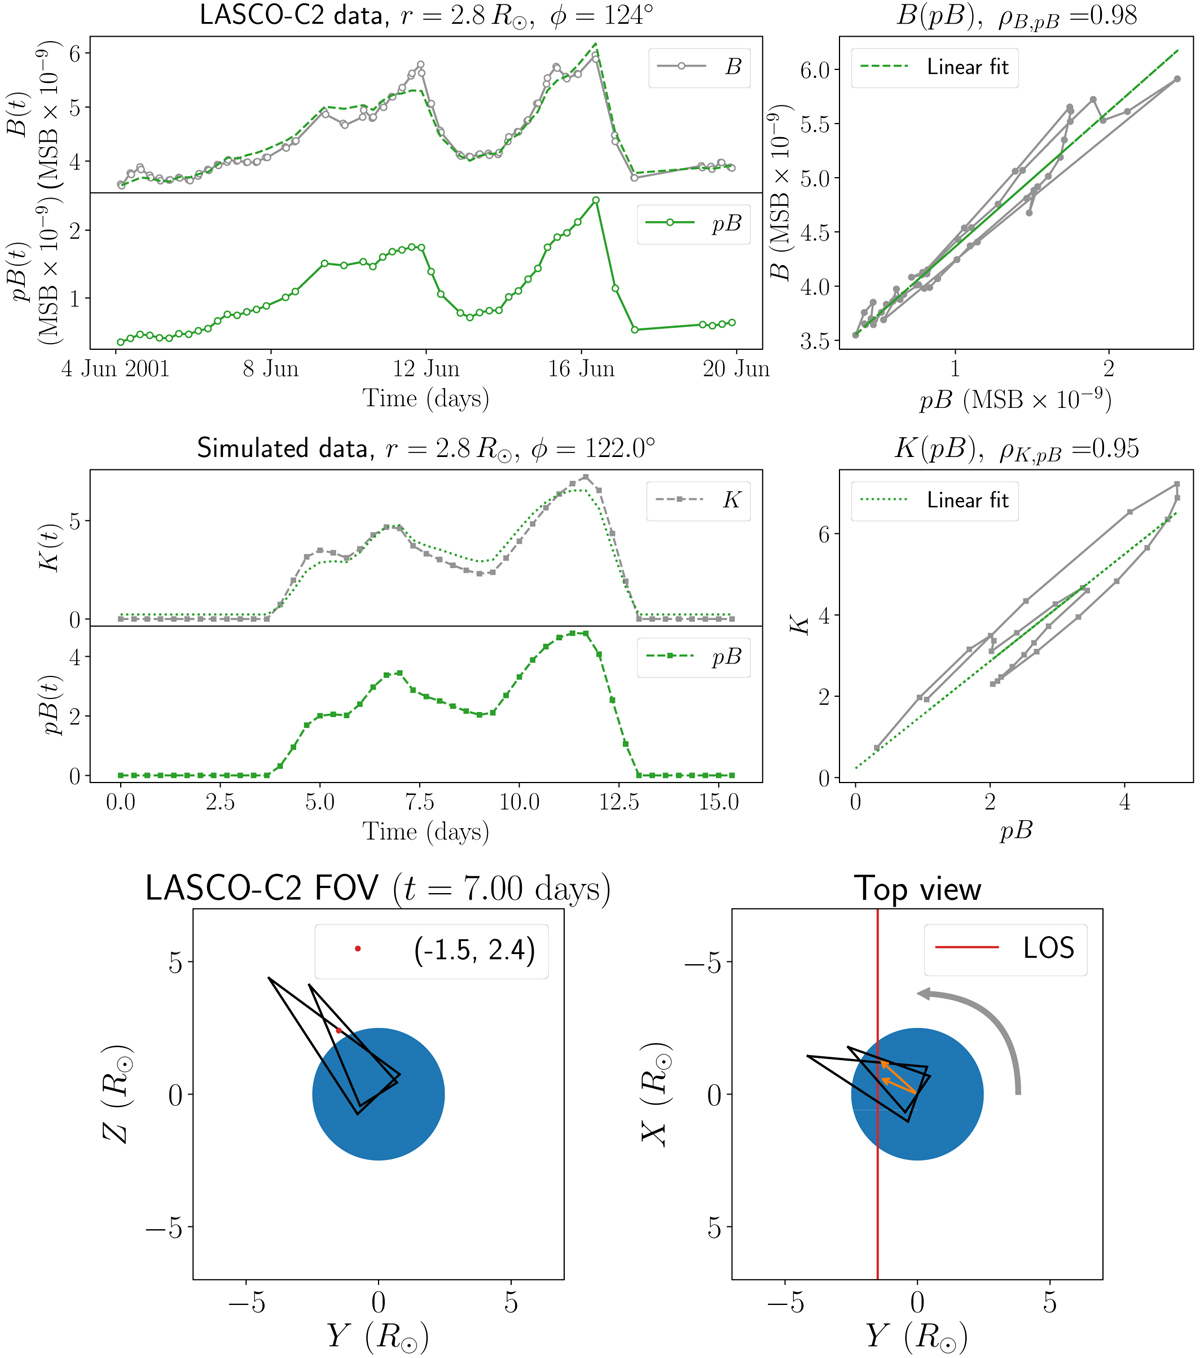
Comparison of variation profiles obtained with observations and simulations. Top panels: variation profiles of B and pB from the LASCO-C2 data (June 2001) and their correlation measured in the pixel at r = 2.8 R⊙ and ϕ = 124°. Mid panels: variation profiles of K and pB and their correlation obtained by the simulation “Sim1” (see Table B.1) at the similar location. The dashed and dotted green lines correspond to the pB profile rescaled according to the linear model best fitting the B-pB and K-pB regressions, respectively. The real and simulated observations cover the time interval of ∼15 days. The simulated intensities are reported in the arbitrary units. Bottom panels: orientation of the two broad simulated streamers at t = 7 days. The position of the pixel of interest is marked with the red dot. X-, Y-, and Z- axes are in the R⊙ units. The gray arrow shows the direction of the solar rotation. The orange arrows in the bottom right panel are the radius vectors r1 and r2 from the center of the Sun to the point where the LOS enters and exits a streamer, respectively (see text for details).
Current usage metrics show cumulative count of Article Views (full-text article views including HTML views, PDF and ePub downloads, according to the available data) and Abstracts Views on Vision4Press platform.
Data correspond to usage on the plateform after 2015. The current usage metrics is available 48-96 hours after online publication and is updated daily on week days.
Initial download of the metrics may take a while.