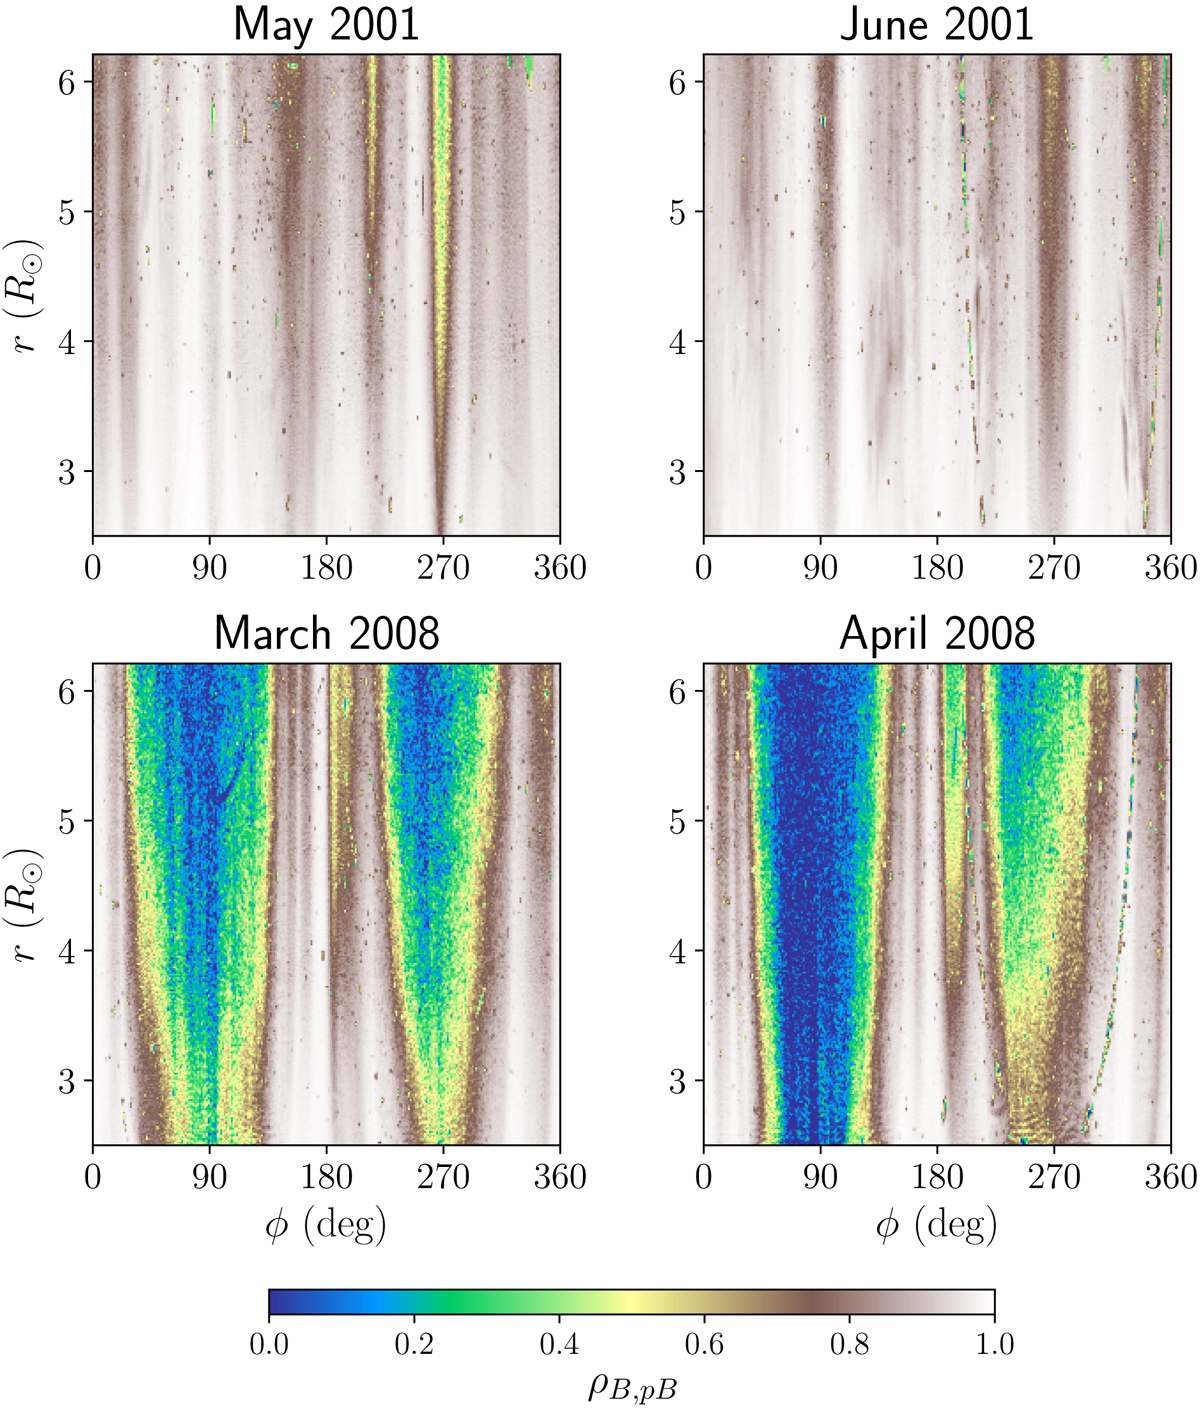
Fig. 5.
Download original image
Correlation coefficient m aps obtained for May and June 2001 (solar maximum, top panels) and for March and April 2008 (solar minimum, bottom panels). In all panels the horizontal axis corresponds to the polar angle ϕ in degrees, and the vertical axis is the heliocentric distance r in the R⊙ units. The colors represent the value of the Pearson’s correlation coefficient ρB, pB which ranges between 0 and 1.
Current usage metrics show cumulative count of Article Views (full-text article views including HTML views, PDF and ePub downloads, according to the available data) and Abstracts Views on Vision4Press platform.
Data correspond to usage on the plateform after 2015. The current usage metrics is available 48-96 hours after online publication and is updated daily on week days.
Initial download of the metrics may take a while.