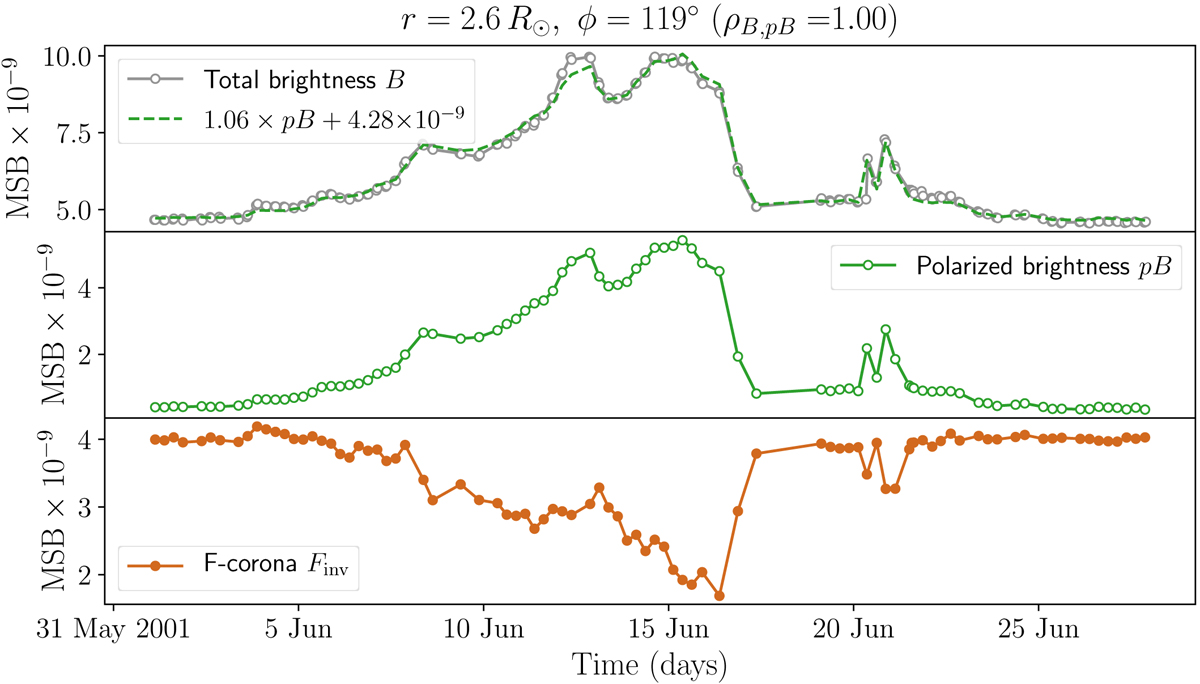
Fig. 3.
Download original image
Evolution of intensity of the total brightness B (top panel), polarized brightness pB (mid panel), and F-corona Finv (bottom panel) measured in the pixel (r = 2.6 R⊙, ϕ = 119°) in a sequence of LASCO-C2 images. The dashed green line in the top panel shows the pB profile re-scaled according to the linear model best fitting the B-pB regression (see Fig. 4). The third panel shows the intensity of the F-corona Finv calculated using the inversion method (see Sect. 3.1 for details). The x-axis is in units of days and covers one month (June 2001), whereas the y-axis is in MSB units. The Pearson’s correlation coefficient of the total and polarized brightness (ρB, pB) is equal to 1.
Current usage metrics show cumulative count of Article Views (full-text article views including HTML views, PDF and ePub downloads, according to the available data) and Abstracts Views on Vision4Press platform.
Data correspond to usage on the plateform after 2015. The current usage metrics is available 48-96 hours after online publication and is updated daily on week days.
Initial download of the metrics may take a while.