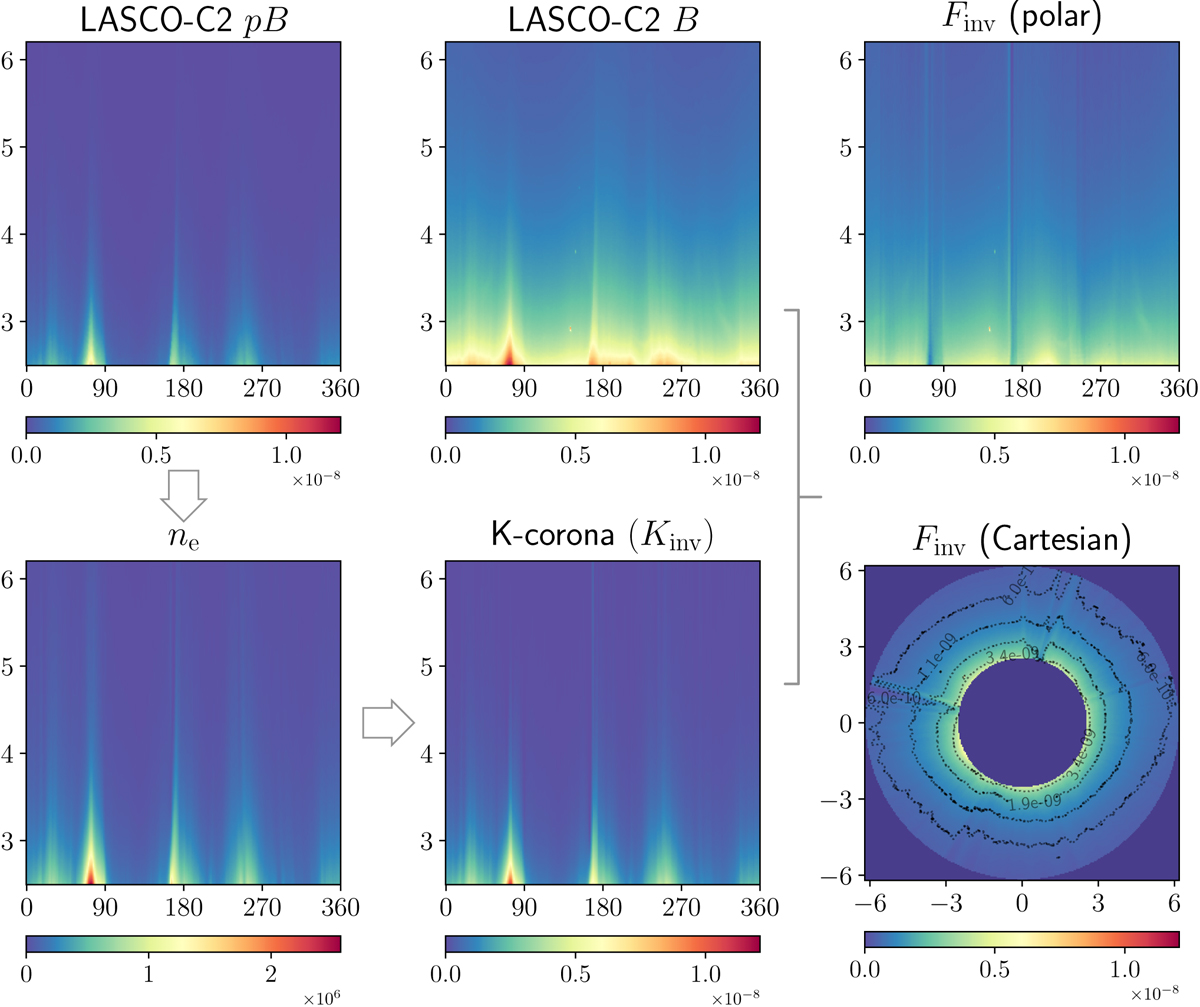
Fig. 2.
Download original image
Polarized (pB, top left panel) and total (B, top mid panel) brightness images obtained with LASCO-C2. pB image was acquired on June 1, 2001 at 9:00, whereas the B image was acquired on June 1, 2001 at 09:07. The electron density ne (bottom left panel), K-corona Kinv (bottom mid panel) and F-corona Finv maps (right panels) are calculated using the inversion technique (see Sect. 3.1). Finv is shown in polar and Cartesian coordinates. The horizontal axis corresponds to the polar angle ϕ in degrees, whereas the vertical axis is the heliocentric distance r in the R⊙ units in all panels except the bottom right, for which both axes correspond to the heliocentric distance. The color bar represents the intensity in MSB units in all panels except the ne map, for which it represents the density in cm−3 units.
Current usage metrics show cumulative count of Article Views (full-text article views including HTML views, PDF and ePub downloads, according to the available data) and Abstracts Views on Vision4Press platform.
Data correspond to usage on the plateform after 2015. The current usage metrics is available 48-96 hours after online publication and is updated daily on week days.
Initial download of the metrics may take a while.