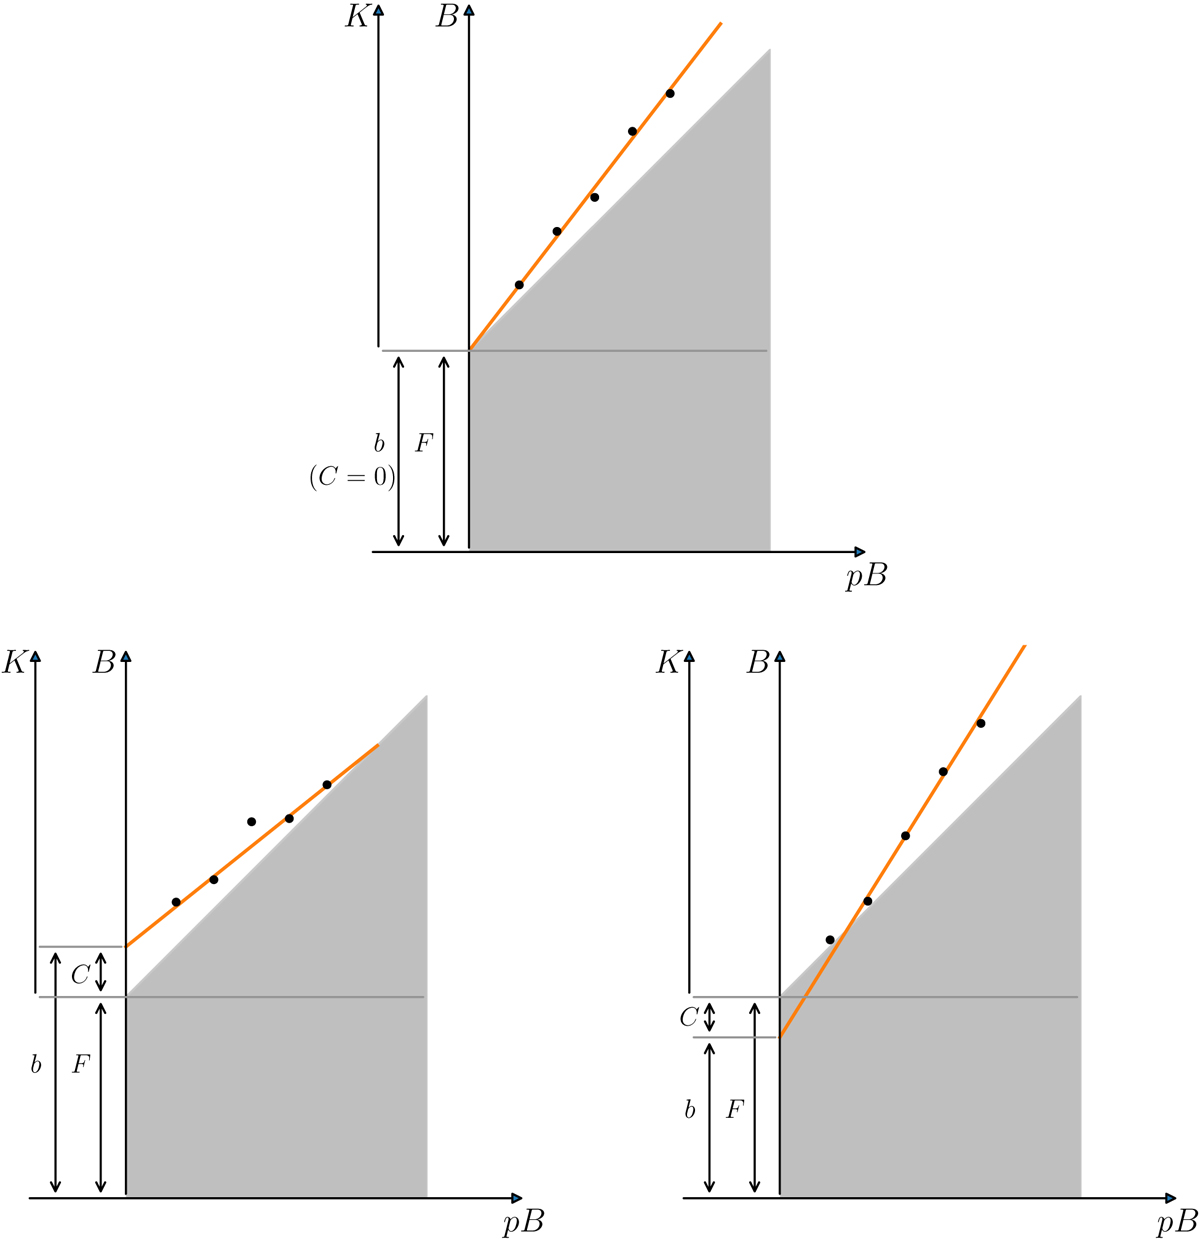
Fig. A.2.
Download original image
Linear function (orange line) fit to the pB, B-measurements (black dots). Three panels represent the cases when the best-fitting parameter b provides an unbiased estimate of the F-corona intensity F (top left panel, C = 0), an overestimated value of F (top right panel, C > 0), and an underestimated value of F (bottom panel, C < 0). Since K ≥ pB, no (pB, B)-point can appear within the gray shaded area below the line B = pB + F with a slope equal to 1.
Current usage metrics show cumulative count of Article Views (full-text article views including HTML views, PDF and ePub downloads, according to the available data) and Abstracts Views on Vision4Press platform.
Data correspond to usage on the plateform after 2015. The current usage metrics is available 48-96 hours after online publication and is updated daily on week days.
Initial download of the metrics may take a while.