Fig. 15.
Download original image
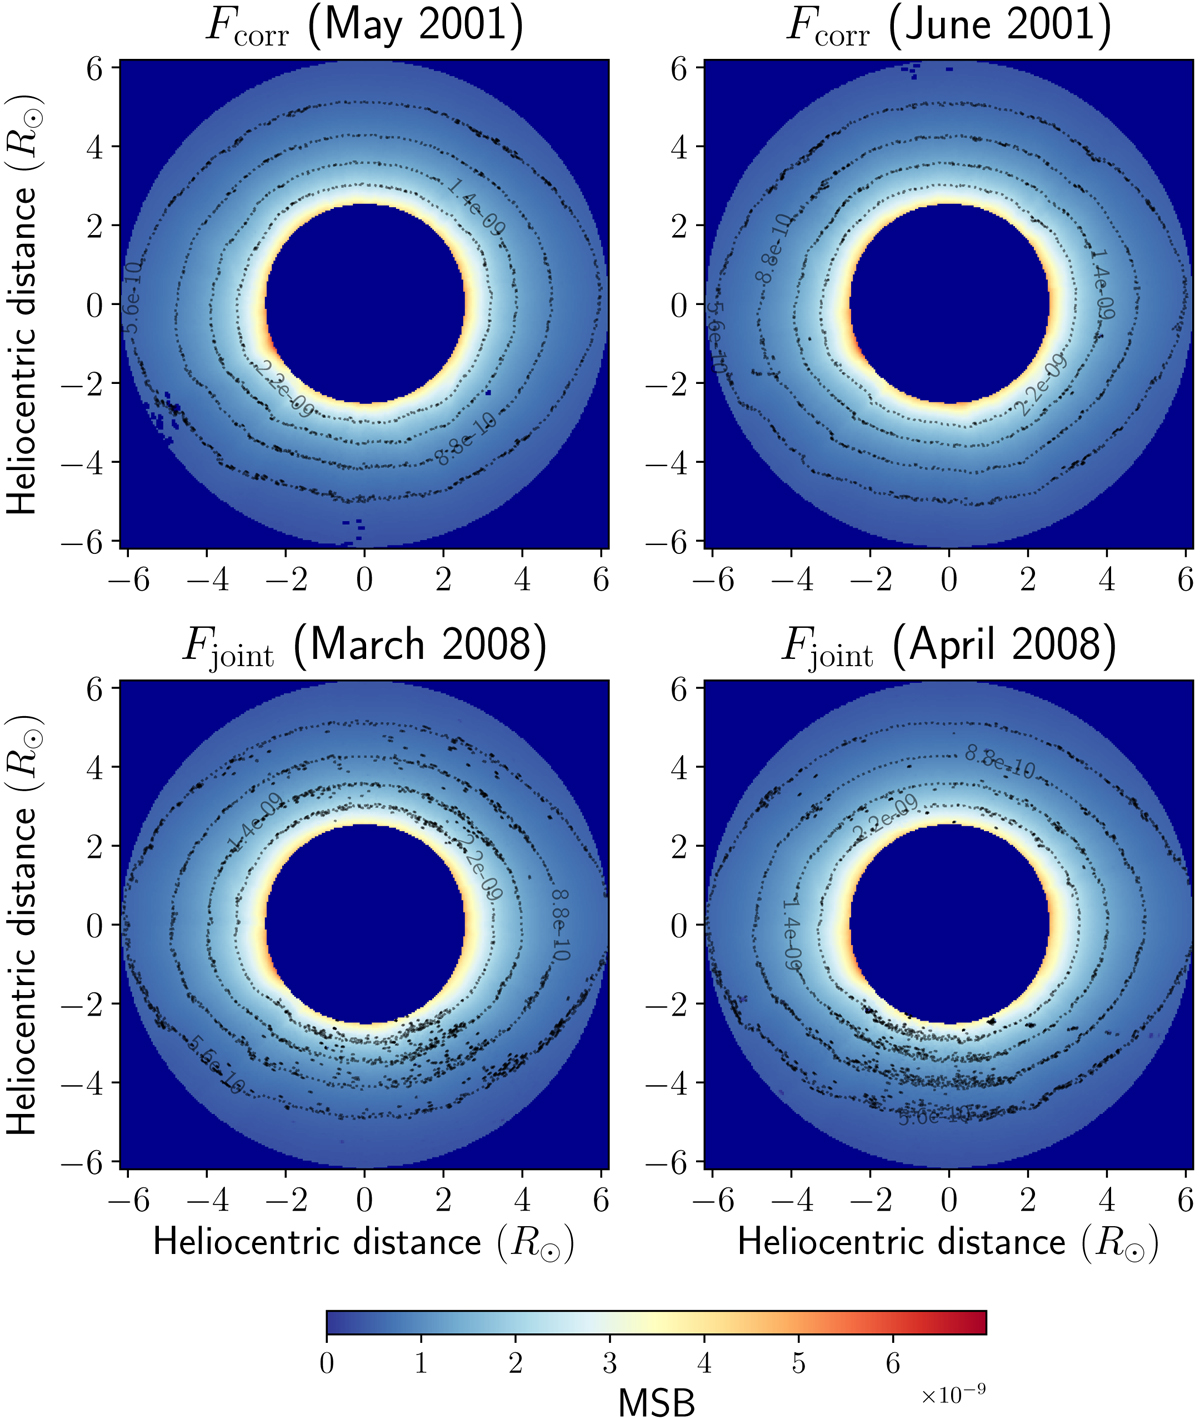
Fcorr and Fjoint maps converted to Cartesian coordinates for May 2001 (top left panel), June 2001 (top right panel), March 2008 (bottom left panel), and April 2008 (bottom right panel). The color bar and contour levels represent the MSB units (as in Figs. 10 and 14). In all panels, both axes correspond to the heliocentric distance in the R⊙ units.
Current usage metrics show cumulative count of Article Views (full-text article views including HTML views, PDF and ePub downloads, according to the available data) and Abstracts Views on Vision4Press platform.
Data correspond to usage on the plateform after 2015. The current usage metrics is available 48-96 hours after online publication and is updated daily on week days.
Initial download of the metrics may take a while.