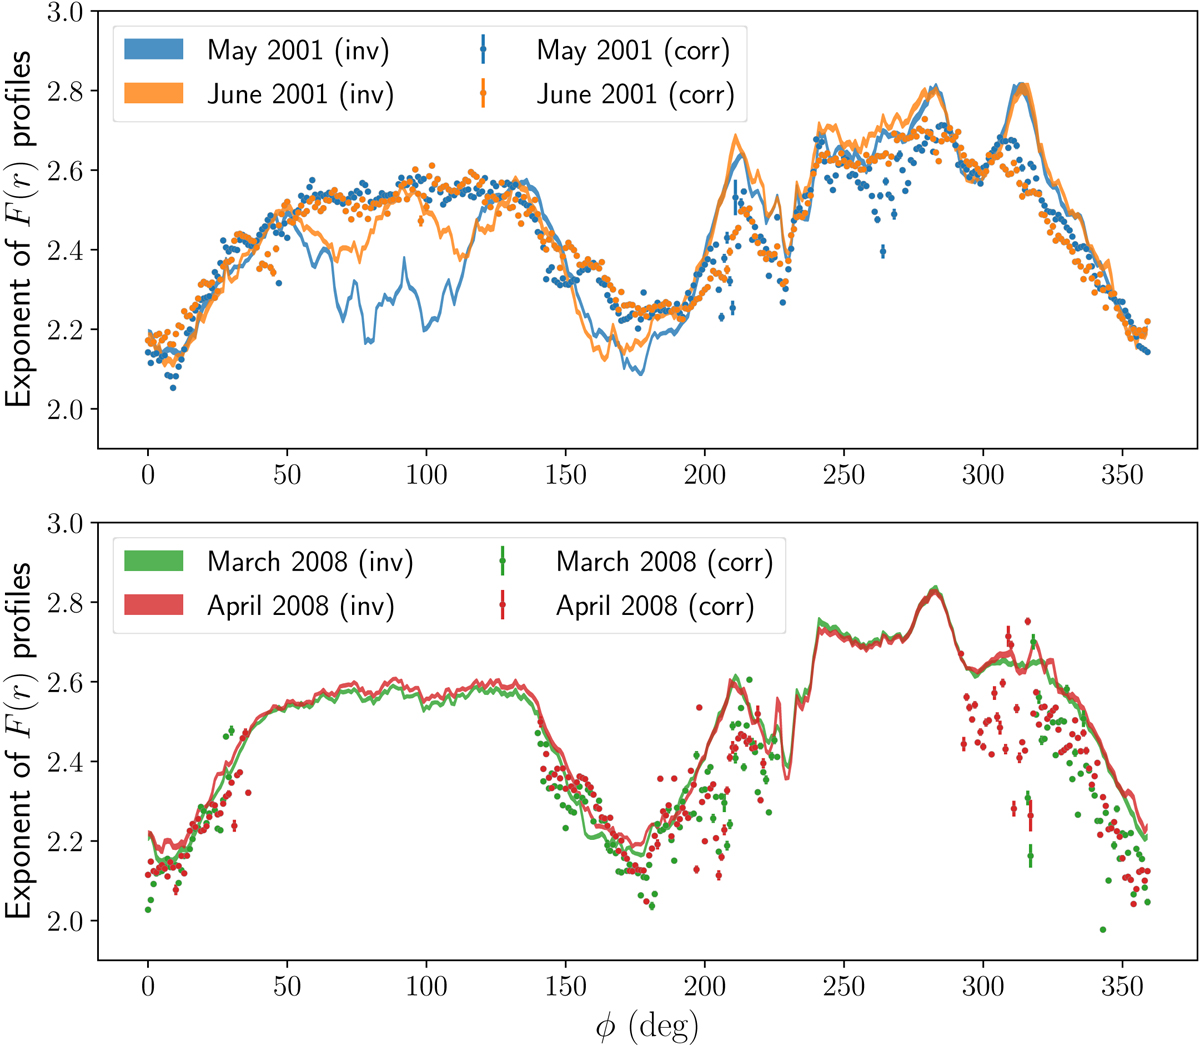
Fig. 13.
Download original image
Exponent of radial profiles of the F-corona calculated with the correlation (corr) and inversion (inv) techniques at r ≥ 3 R⊙. Top and bottom panels: values obtained for the solar maximum (May and June 2001) and solar minimum (March and April 2008) months, respectively. The best-fitting 1-σ uncertainties are shown by means of the error bars for the correlation method and the width of shaded areas for the inversion method.
Current usage metrics show cumulative count of Article Views (full-text article views including HTML views, PDF and ePub downloads, according to the available data) and Abstracts Views on Vision4Press platform.
Data correspond to usage on the plateform after 2015. The current usage metrics is available 48-96 hours after online publication and is updated daily on week days.
Initial download of the metrics may take a while.