Fig. 10.
Download original image
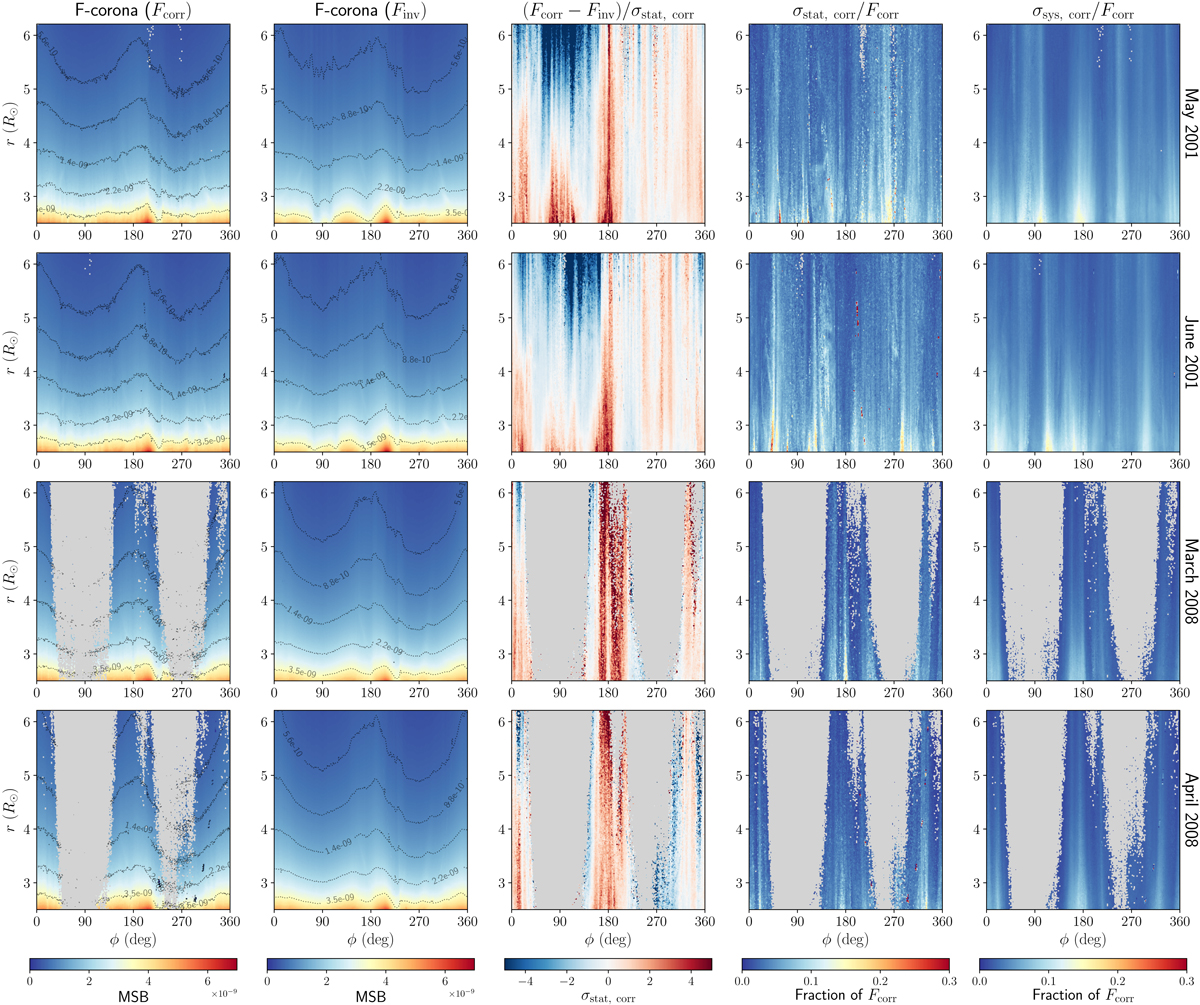
F-corona maps calculated applying the correlation and inversion techniques for different months of data. The four rows correspond to May 2001, June 2001, March 2008, and April 2008 (from top to bottom). First two columns: intensity maps obtained with the correlation method (Fcorr) and the inversion method (Finv). Third column: difference maps (Fcorr − Finv) normalized to the statistical uncertainties on Fcorr (σstat, corr). The relative statistical and systematic uncertainties on Fcorr are shown in the fourth and fifth columns, respectively. In all panels, the horizontal axis corresponds to the polar angle ϕ in degrees, and the vertical axis is the heliocentric distance r in the R⊙ units. The color bars represent the MSB in the first two columns, the σstat, corr in the third column and the fraction of Fcorr in the last two columns. The contour levels (dotted black lines) are reported in the MSB units. Blank pixels colored in gray appear in the regions where the correlation method is not applicable (see text for details).
Current usage metrics show cumulative count of Article Views (full-text article views including HTML views, PDF and ePub downloads, according to the available data) and Abstracts Views on Vision4Press platform.
Data correspond to usage on the plateform after 2015. The current usage metrics is available 48-96 hours after online publication and is updated daily on week days.
Initial download of the metrics may take a while.