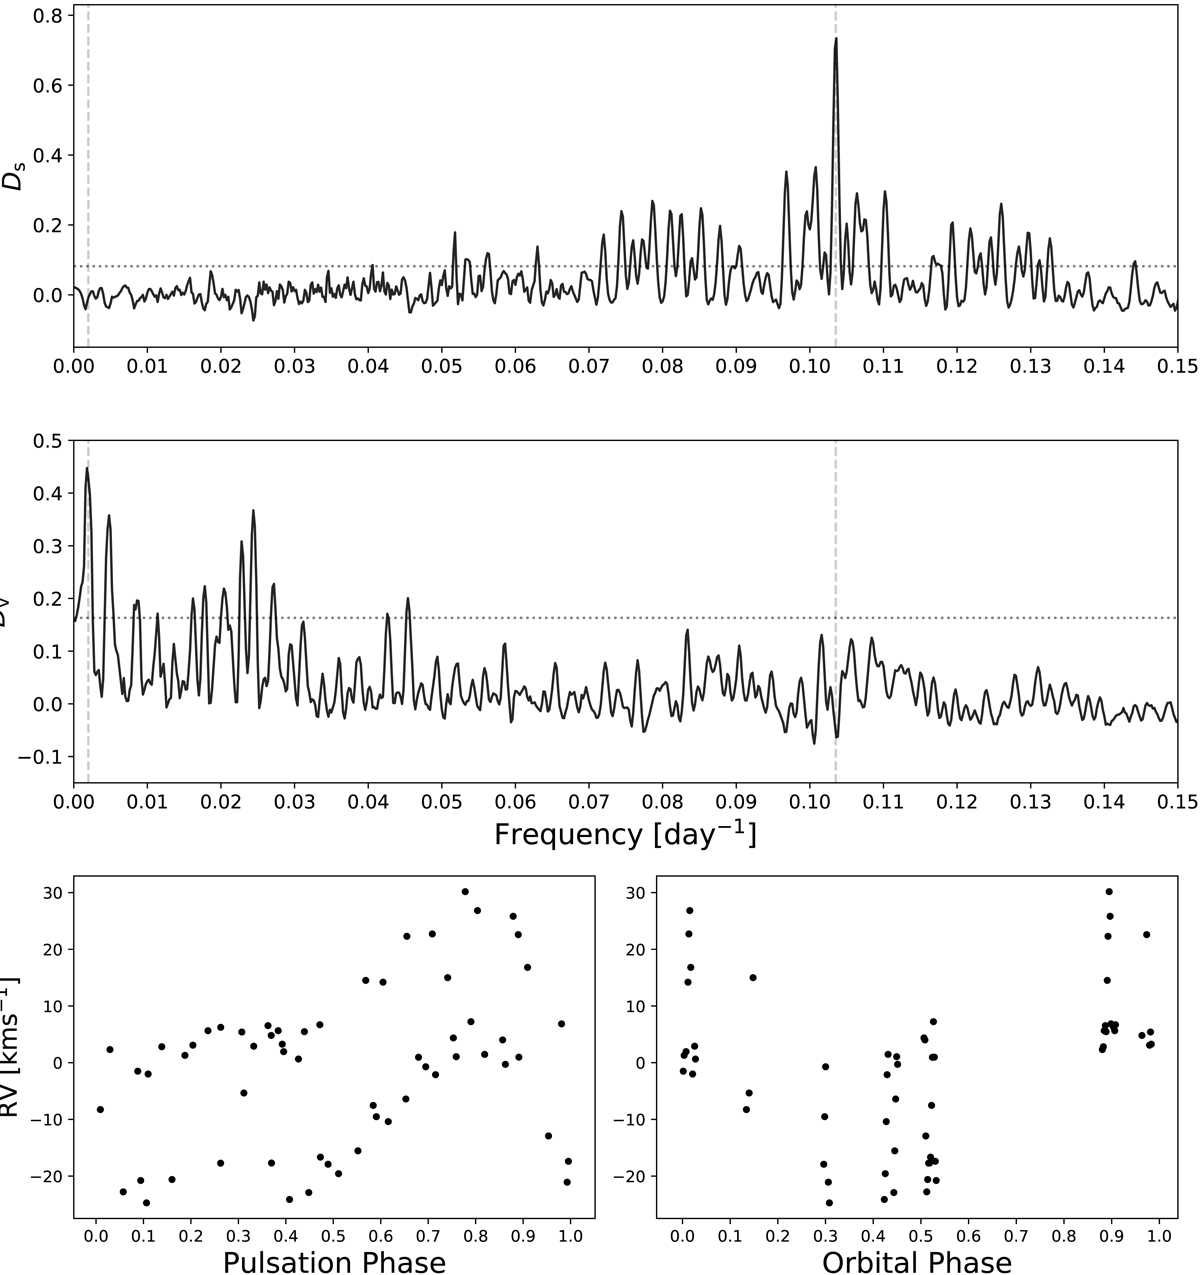
Fig. 8.
Download original image
Partial periodogram results for S Muscae. Upper panel: shape periodogram (partial USuRPER) result. The vertical dashed lines represent the 505 days orbital period and the 9.65996 days pulsation period. The shape periodogram is designed to account for spectral shape variation signals only, thus eliminating the 505 days signal originated in orbital motion. Middle panel: shift periodogram (partial PDC) result, designed to account for Doppler-shift variations only, therefore showing a significant peak in the 505 days orbital period, while eliminating the 9.65996 days pulsation originated peak. An additional peak, matching a 40 days period, appears in the periodogram and might be caused by some kind of a window function related to the observation times. Lower panels: RVs extracted for the observations, folded according to the 9.65996 days pulsation phase (left) and 505 orbital phase (right). The dotted horizontal line in both panels corresponds to a FAP level of 10−4, obtained by the permutation test procedure.
Current usage metrics show cumulative count of Article Views (full-text article views including HTML views, PDF and ePub downloads, according to the available data) and Abstracts Views on Vision4Press platform.
Data correspond to usage on the plateform after 2015. The current usage metrics is available 48-96 hours after online publication and is updated daily on week days.
Initial download of the metrics may take a while.