Fig. 6.
Download original image
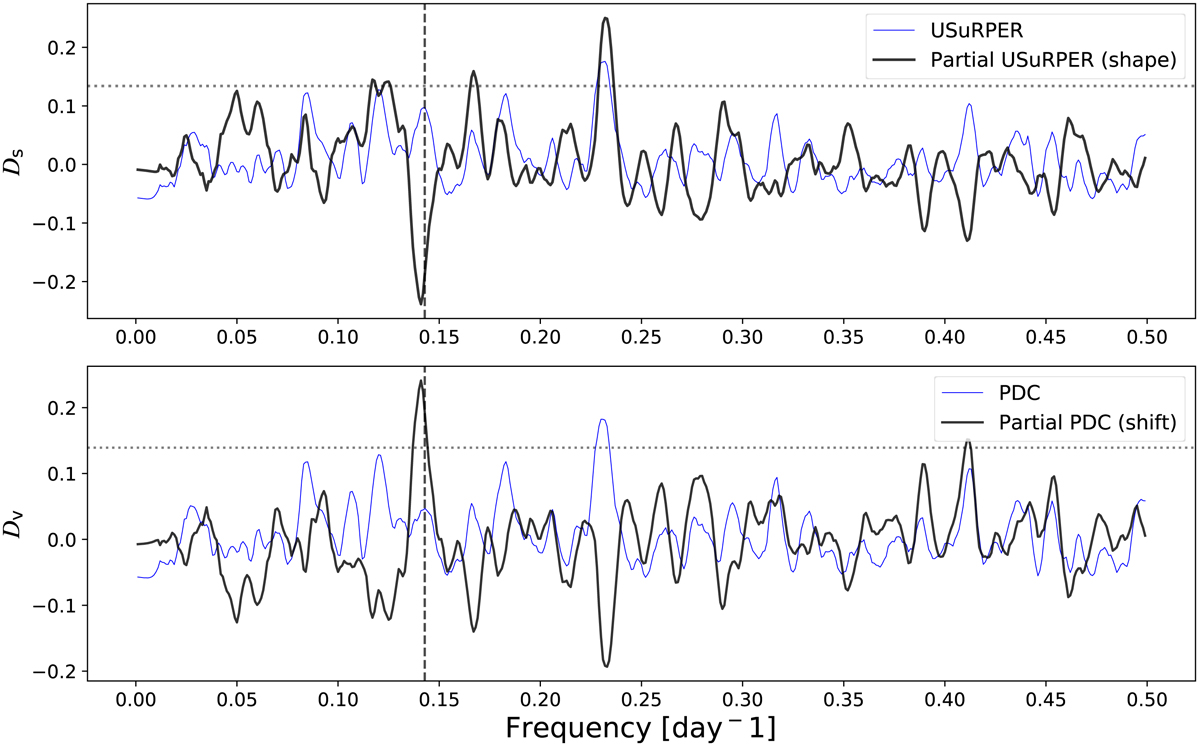
Partial periodogram results for the simulated planet host with random spectral variability. Upper panel: USuRPER and partial USuRPER (shape) periodogram results. The dashed vertical line marks the expected planetary frequency, in which no significant peak is present. Lower panel: PDC and partial PDC (shift) periodogram results for the same data. No peak appears in the PDC periodogram, as the planetary signal is obscured by the spectral shape variations induced noise. In the matching shift periodogram (partial PDC), on the contrary, a significant peak does appear in the expected planetary frequency. The dotted horizontal line in both panels corresponds to a FAP level of 10−4, obtained by the permutation test procedure.
Current usage metrics show cumulative count of Article Views (full-text article views including HTML views, PDF and ePub downloads, according to the available data) and Abstracts Views on Vision4Press platform.
Data correspond to usage on the plateform after 2015. The current usage metrics is available 48-96 hours after online publication and is updated daily on week days.
Initial download of the metrics may take a while.