Fig. 5.
Download original image
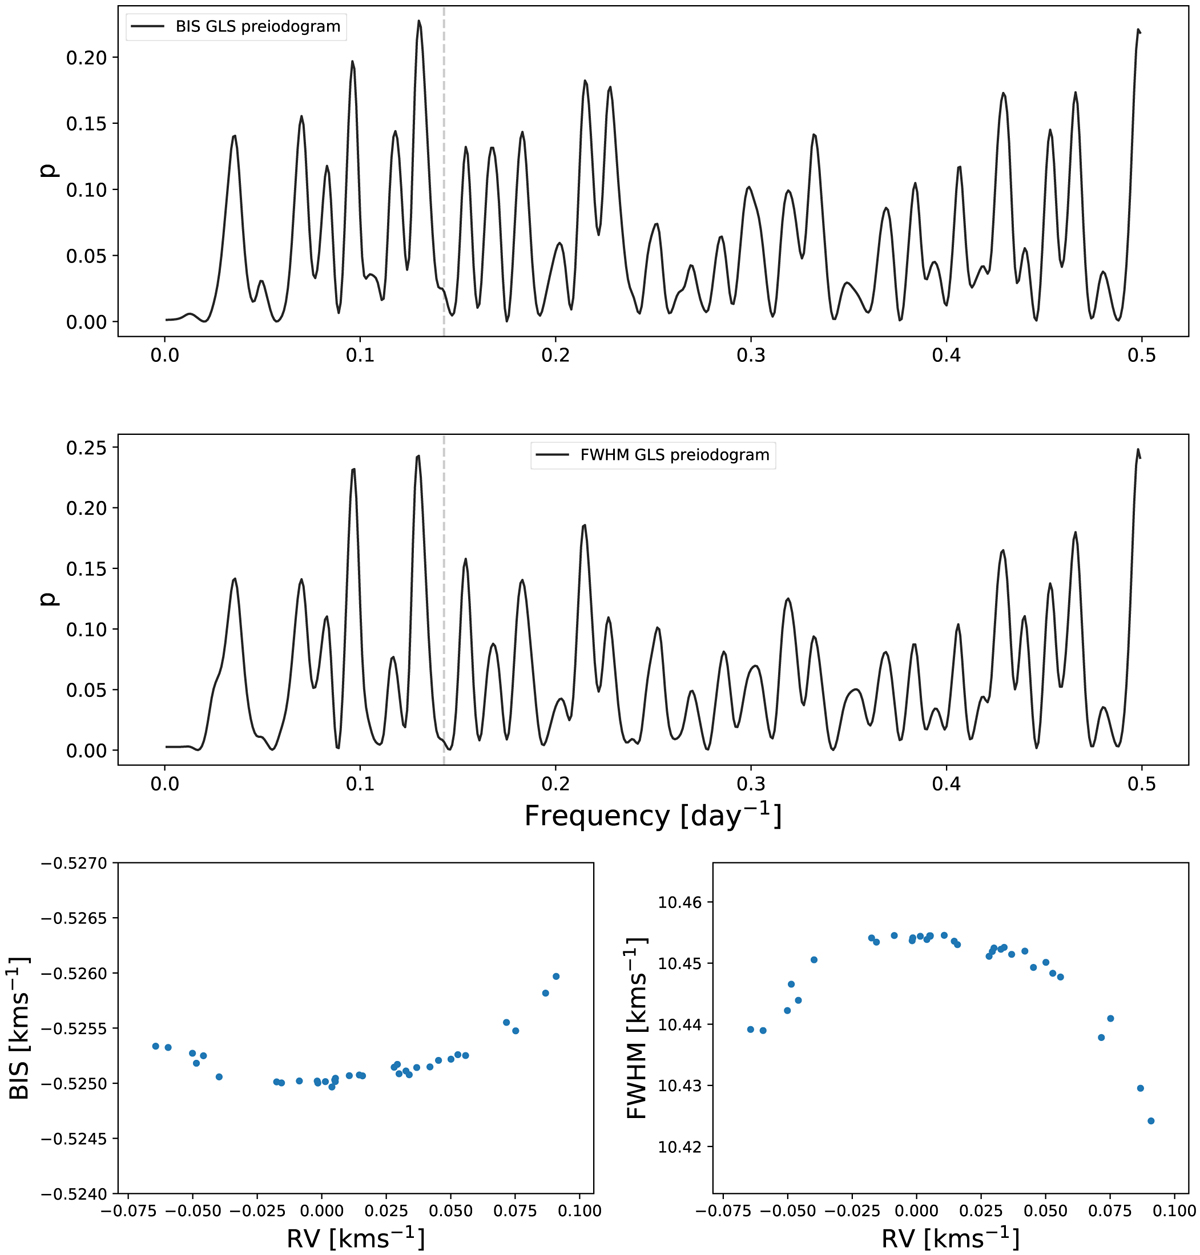
Activity-indicators-based analysis of the simulated planet host with random spectral variability. Upper and middle panels: GLS periodogram for the BIS and FWHM data, respectively. The dashed vertical lines mark the expected 7-days planetary frequency. Lower panels: bisector and full-width half maximum data as a function of RVs obtained for the spectra through cross-correlating against a PHOENIX template.
Current usage metrics show cumulative count of Article Views (full-text article views including HTML views, PDF and ePub downloads, according to the available data) and Abstracts Views on Vision4Press platform.
Data correspond to usage on the plateform after 2015. The current usage metrics is available 48-96 hours after online publication and is updated daily on week days.
Initial download of the metrics may take a while.