Fig. 3.
Download original image
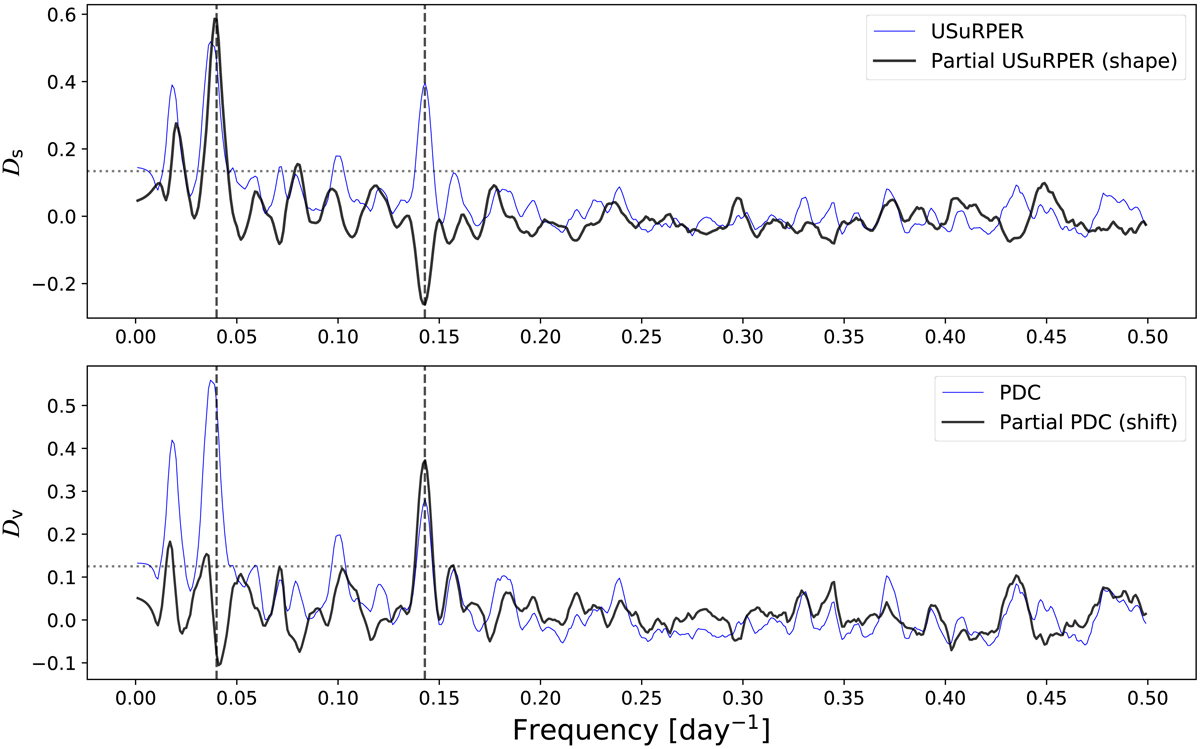
Partial periodogram results for the simulated periodically active star hosting a planet. Upper panel: USuRPER periodogram results. The dashed vertical line marks the expected activity and planetary frequencies (25 and 7 days). USuRPER shows significant peaks in both frequencies, while the partial USuRPER, the shape periodogram, shows a significant peak in the activity frequency only. Lower panel: matching PDC periodograms. As it is designed to do, the partial PDC, the shift periodogram, presents only the peak matching the planetary period (7 days), and not the one matching the activity period as the PDC periodogram. The dotted horizontal line in both panels corresponds to a FAP level of 10−4, obtained by the permutation test procedure.
Current usage metrics show cumulative count of Article Views (full-text article views including HTML views, PDF and ePub downloads, according to the available data) and Abstracts Views on Vision4Press platform.
Data correspond to usage on the plateform after 2015. The current usage metrics is available 48-96 hours after online publication and is updated daily on week days.
Initial download of the metrics may take a while.