Fig. 1.
Download original image
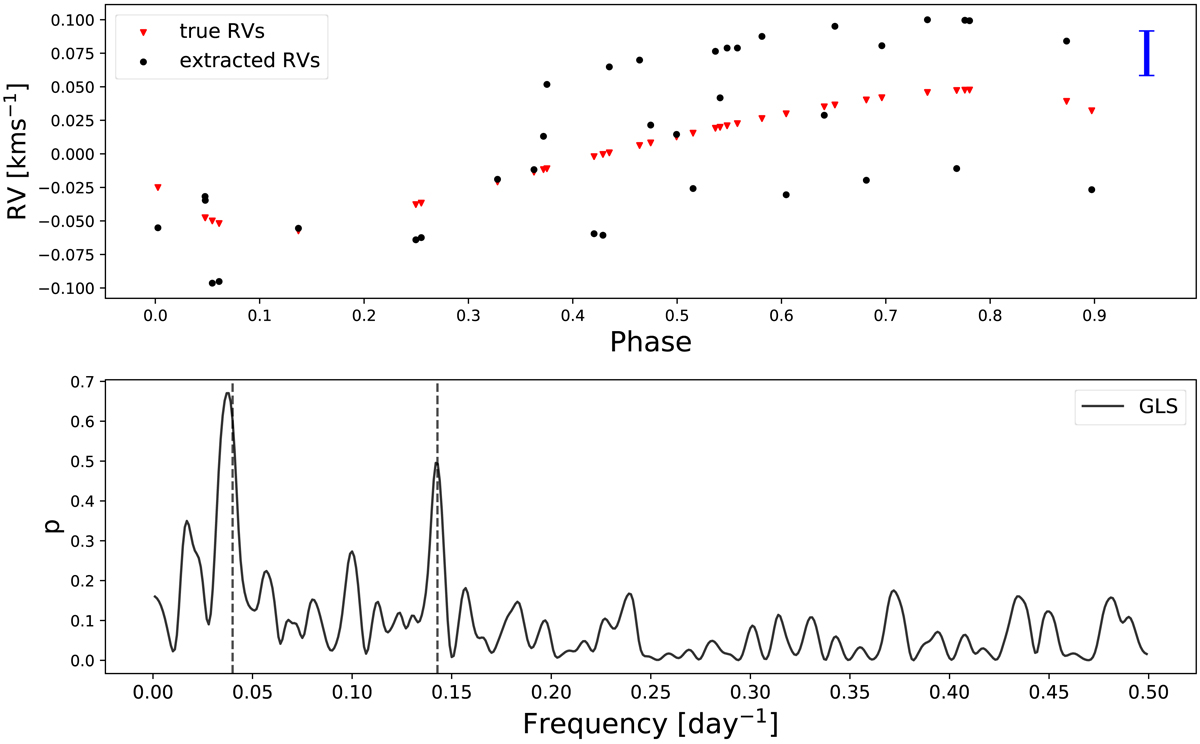
RV based analysis for the simulated periodically active planet-hosting star. Upper panel: RVs obtained for the spectra through cross-correlating against a PHOENIX template. The RVs are phase-folded according to the planetary period. The blue bar stands for the mean difference between true and extracted RV. Lower panel: GLS periodogram for the RV data. The dashed vertical lines mark the expected activity and planetary frequency, matching 7 and 25 days period.
Current usage metrics show cumulative count of Article Views (full-text article views including HTML views, PDF and ePub downloads, according to the available data) and Abstracts Views on Vision4Press platform.
Data correspond to usage on the plateform after 2015. The current usage metrics is available 48-96 hours after online publication and is updated daily on week days.
Initial download of the metrics may take a while.