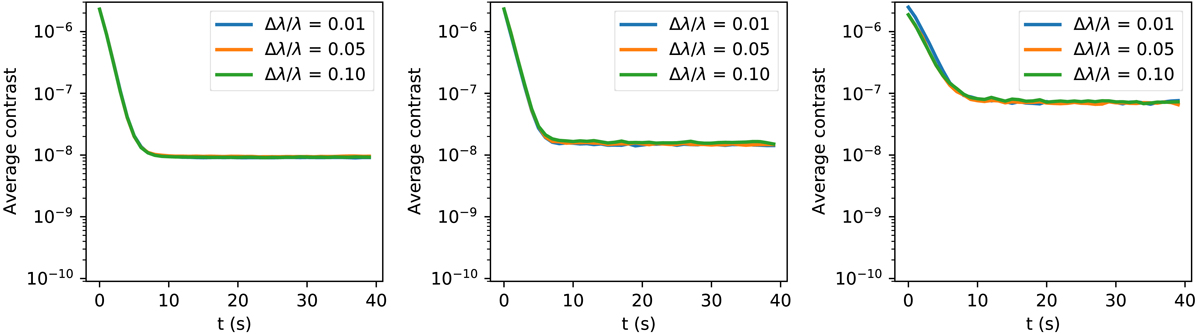
Fig. 9.
Download original image
Median contrast in the dark hole region (−20 λ/D to 20 λ/D in x by −20 λ/D to 20 λ/D in y) as a function of time. Each frame has an exposure time of 1 second. The contrast is shown for three different spectral separations, which are shown in different colors. The three figures are for a 0th (left), 5th (middle), and 7.5th (right) magnitude star as observed by MagAO-X. The final median contrast is almost independent of the spectral separation between the two channels. The smallest spectral separation does lead to the deepest contrasts. The simulations with a fainter star (right) have been done with a lower feedback gain, which increased the convergence time to 25 s.
Current usage metrics show cumulative count of Article Views (full-text article views including HTML views, PDF and ePub downloads, according to the available data) and Abstracts Views on Vision4Press platform.
Data correspond to usage on the plateform after 2015. The current usage metrics is available 48-96 hours after online publication and is updated daily on week days.
Initial download of the metrics may take a while.