Fig. 4.
Download original image
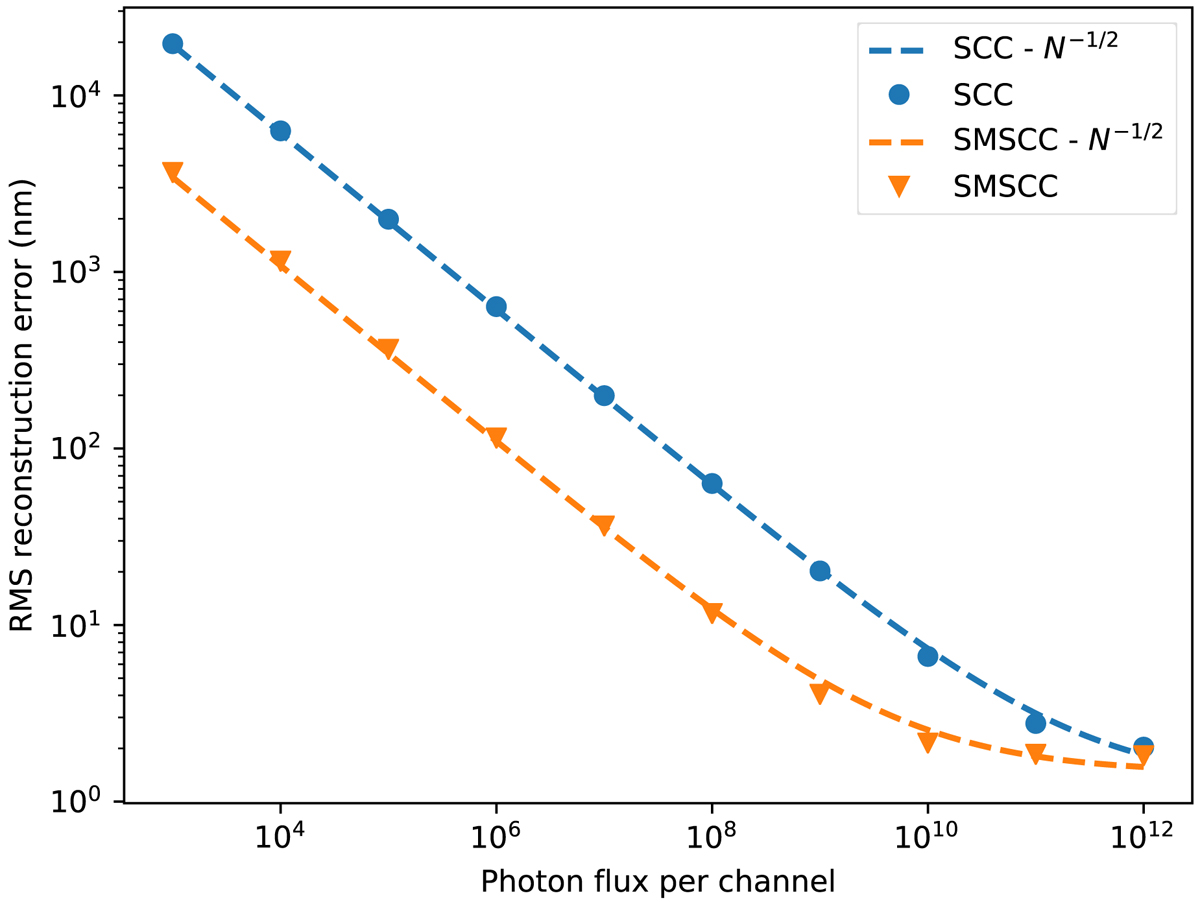
Reconstruction rms as a function of photon flux per spectral channel. The blue circles show the rms of a classic SCC, and the orange triangles show the rms of the SM-SCC. The dashed lines are fits of the expected N−1/2 behavior due to photon noise. Around a photon flux of 109 − 1010, the curve of the SM-SCC starts to flatten out due to intrinsic reconstruction errors. For a classic SCC, this happens at a higher photon flux but at a similar reconstruction rms. The input rms was 30 nm, which indicates that both sensors can reconstruct the wavefront with errors smaller than 5% at high flux levels.
Current usage metrics show cumulative count of Article Views (full-text article views including HTML views, PDF and ePub downloads, according to the available data) and Abstracts Views on Vision4Press platform.
Data correspond to usage on the plateform after 2015. The current usage metrics is available 48-96 hours after online publication and is updated daily on week days.
Initial download of the metrics may take a while.