Fig. 9.
Download original image
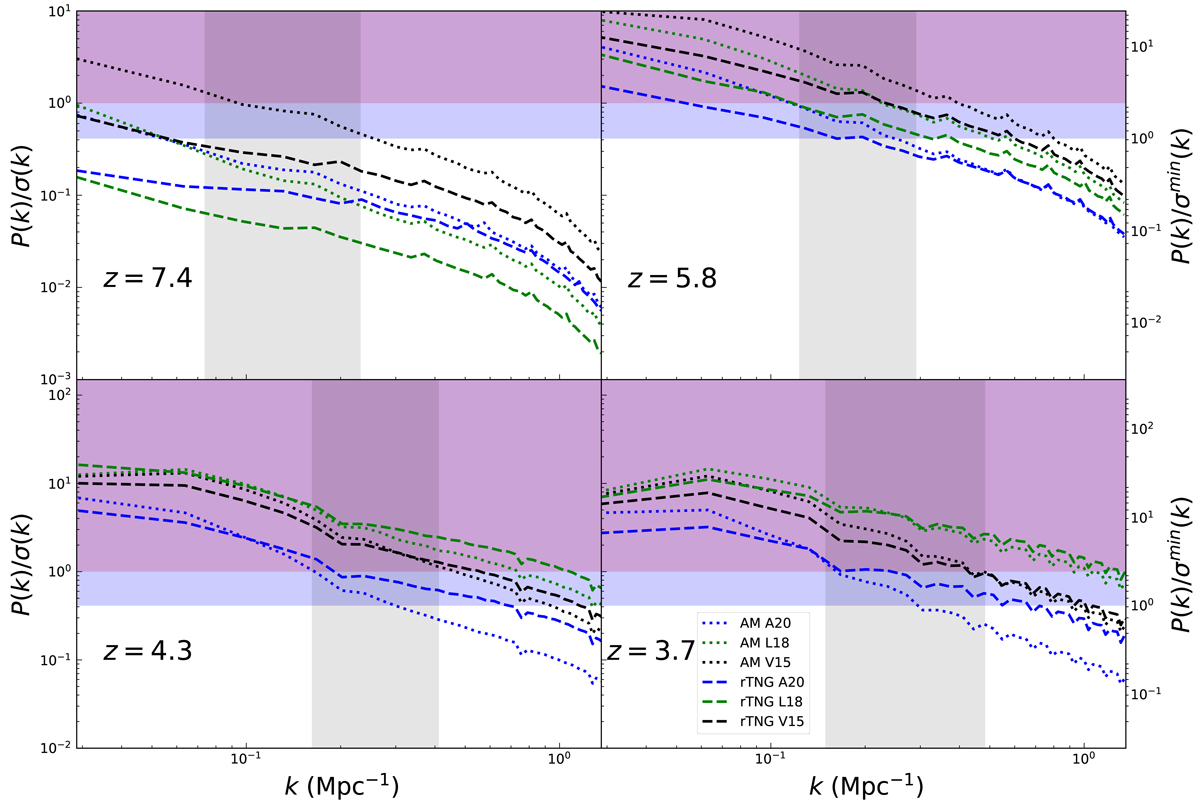
S/N for a 4° ×4° FYST [CII] LIM mock survey of tsurv = 4000 hours. It consists of four tomographic scans of 40 GHz bandwidth each centered at z = 3.7, 4.3, 5.8, and 7.4. The S/N combines three effects: the instrumental white noise, the sample variance within each k-bin, and the attenuation due to smoothing by the instrumental beam. Lines are color-coded according to the used SFR-to-L[CII] relation, blue lines for A20, green lines for L18, and black lines for V15. The magenta painted area represents the S/N > 1 values for the minimum Δk considered (Δk = 0.034 Mpc−1, main y-axis), whereas the purple painted area denotes the S/N > 1 values for the maximum Δk considered (Δk = 0.34 Mpc−1, secondary y-axis). Gray areas cover all k values for which ![]() as indicators for the transition scale between the clustering dominated to the shot noise dominated scales.
as indicators for the transition scale between the clustering dominated to the shot noise dominated scales.
Current usage metrics show cumulative count of Article Views (full-text article views including HTML views, PDF and ePub downloads, according to the available data) and Abstracts Views on Vision4Press platform.
Data correspond to usage on the plateform after 2015. The current usage metrics is available 48-96 hours after online publication and is updated daily on week days.
Initial download of the metrics may take a while.