Fig. 7.
Download original image
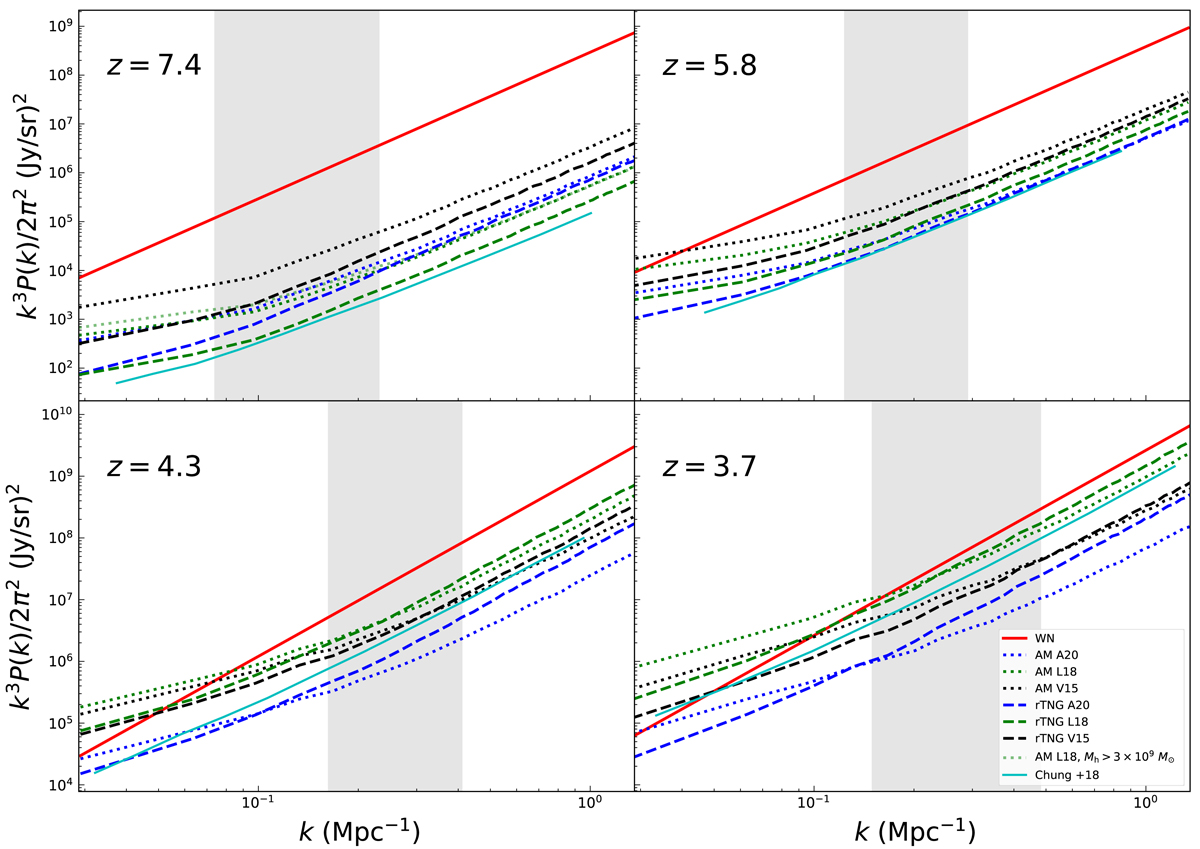
Spherically averaged PS for a 4° ×4° [CII] mock survey subdivided in four tomographic scans of 40 GHz bandwidth each centered at z = 3.7, 4.3, 5.8, and 7.4. The averaging takes place in the Fourier space in k-bins of Δk = 0.034 Mpc−1. Predictions from our rTNG and AM models are shown by dashed and dotted lines, respectively. Lines are color-coded according to the used SFR-to-L[CII] relation, blue lines for A20, green lines for L18, and black lines for V15. L18 is also plotted at z = 7.4 including the contribution of 3 × 10⁹ − 1010 M⊙ halos for our AM model (faint green dotted line). The red lines are the power spectrum of the instrumental single-k-mode white noise (labeled as WN), PWN, of the scheduled FYST LIM survey. Gray areas cover the scales at which ![]() for our various models. This illustrates the transition from clustering-dominated to shot noise-dominated scales. Predictions from Chung et al. (2020, turquoise line) are also shown for comparison.
for our various models. This illustrates the transition from clustering-dominated to shot noise-dominated scales. Predictions from Chung et al. (2020, turquoise line) are also shown for comparison.
Current usage metrics show cumulative count of Article Views (full-text article views including HTML views, PDF and ePub downloads, according to the available data) and Abstracts Views on Vision4Press platform.
Data correspond to usage on the plateform after 2015. The current usage metrics is available 48-96 hours after online publication and is updated daily on week days.
Initial download of the metrics may take a while.