Fig. 6.
Download original image
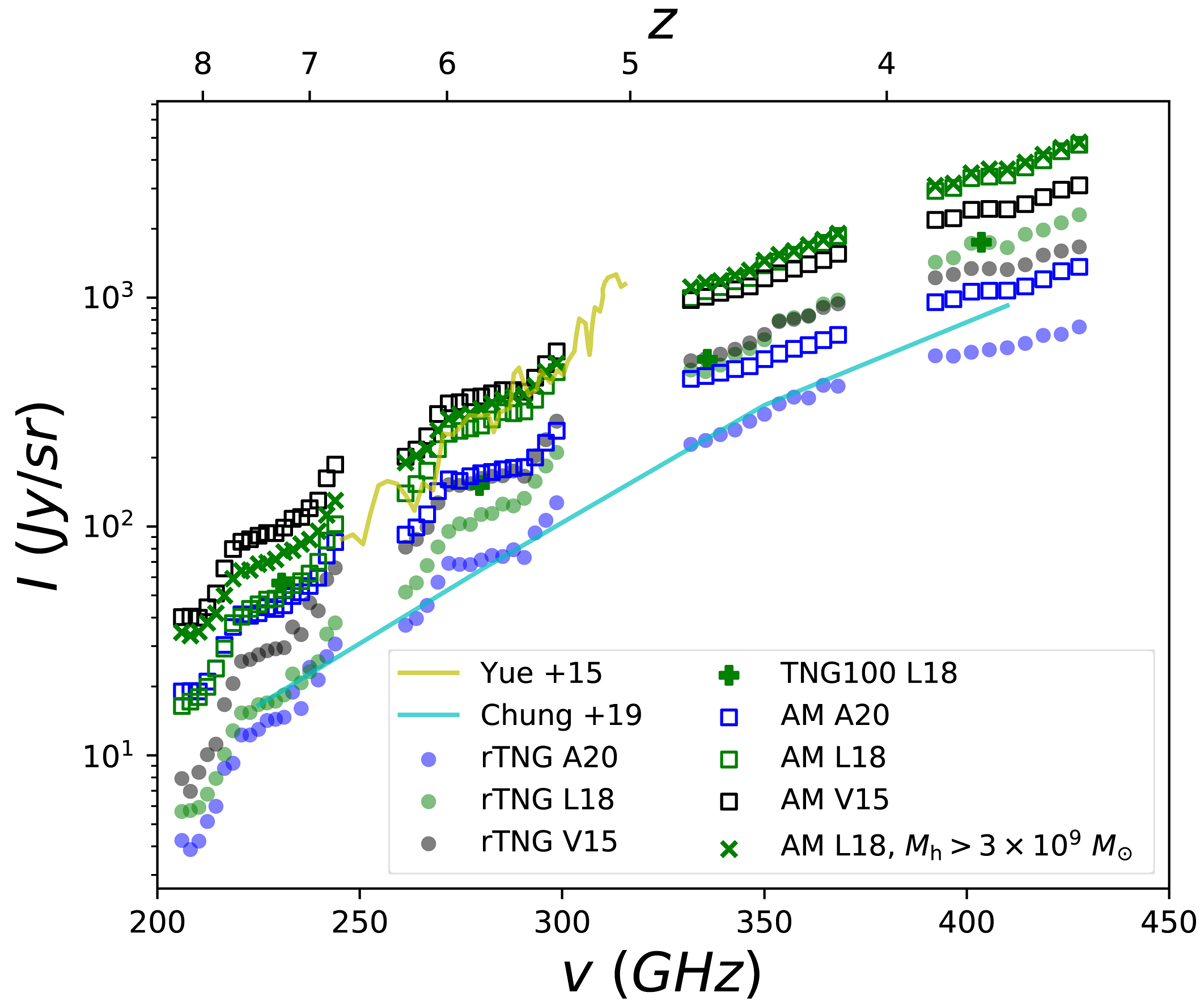
Mean [CII] line intensity as a function of the observed frequency (equivalently, emitted redshift). Predictions from our rTNG and AM models are shown by dots and open squares, respectively. Symbols are color-coded according to the used SFR-to-L[CII] relation, blue symbols for A20, green symbols for L18, and black symbols for V15. L18 is also plotted including the contribution of 3 × 10⁹ − 1010 M⊙ halos for our AM model (green x-shaped points) and the TNG100-1 snapshots (green plus-shaped points; see text for more details). Predictions from Yue et al. (2015, yellow line) and Chung et al. (2020, turquoise line) are also shown for comparison.
Current usage metrics show cumulative count of Article Views (full-text article views including HTML views, PDF and ePub downloads, according to the available data) and Abstracts Views on Vision4Press platform.
Data correspond to usage on the plateform after 2015. The current usage metrics is available 48-96 hours after online publication and is updated daily on week days.
Initial download of the metrics may take a while.