Fig. 4.
Download original image
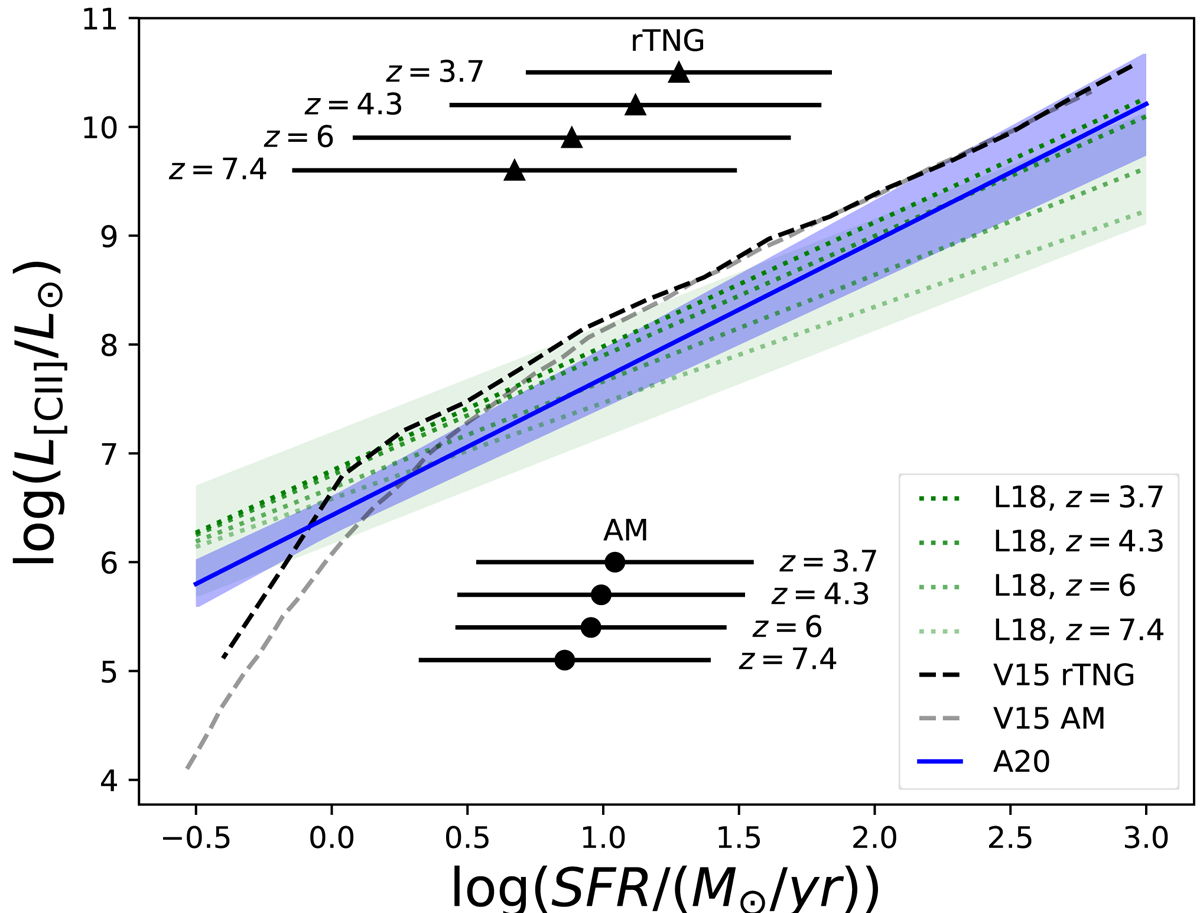
SFR − L[CII] relation applied to our cone, as predicted in L18 at z ∼ 3.7, 4.3, 5.8, and 7.4 (green dotted lines) and observed in A20 at 4.4 < z < 9.1 (blue line) along with its 1σ scatter (blue shaded region). For clarity, the redshift-independent 1σ scatter of 0.5 dex inferred in L18 is only shown around their z = 5.8 mean relation (green shaded region). The mean metallicity-dependent SFR − L[CII] relation of V15 applied to our rTNG and AM models are shown by the dark and light gray dashed lines, respectively. The horizontal black lines represent the SFR ranges containing 25%−75% of the cumulative cosmic SFRD at z ∼ 3.7, 4.3, 5.8, and 7.4 in our rTNG (triangles) and AM (circles) models. These ranges highlight the SFRs of galaxies that contribute the most to the cosmic SFRD at these redshifts.
Current usage metrics show cumulative count of Article Views (full-text article views including HTML views, PDF and ePub downloads, according to the available data) and Abstracts Views on Vision4Press platform.
Data correspond to usage on the plateform after 2015. The current usage metrics is available 48-96 hours after online publication and is updated daily on week days.
Initial download of the metrics may take a while.