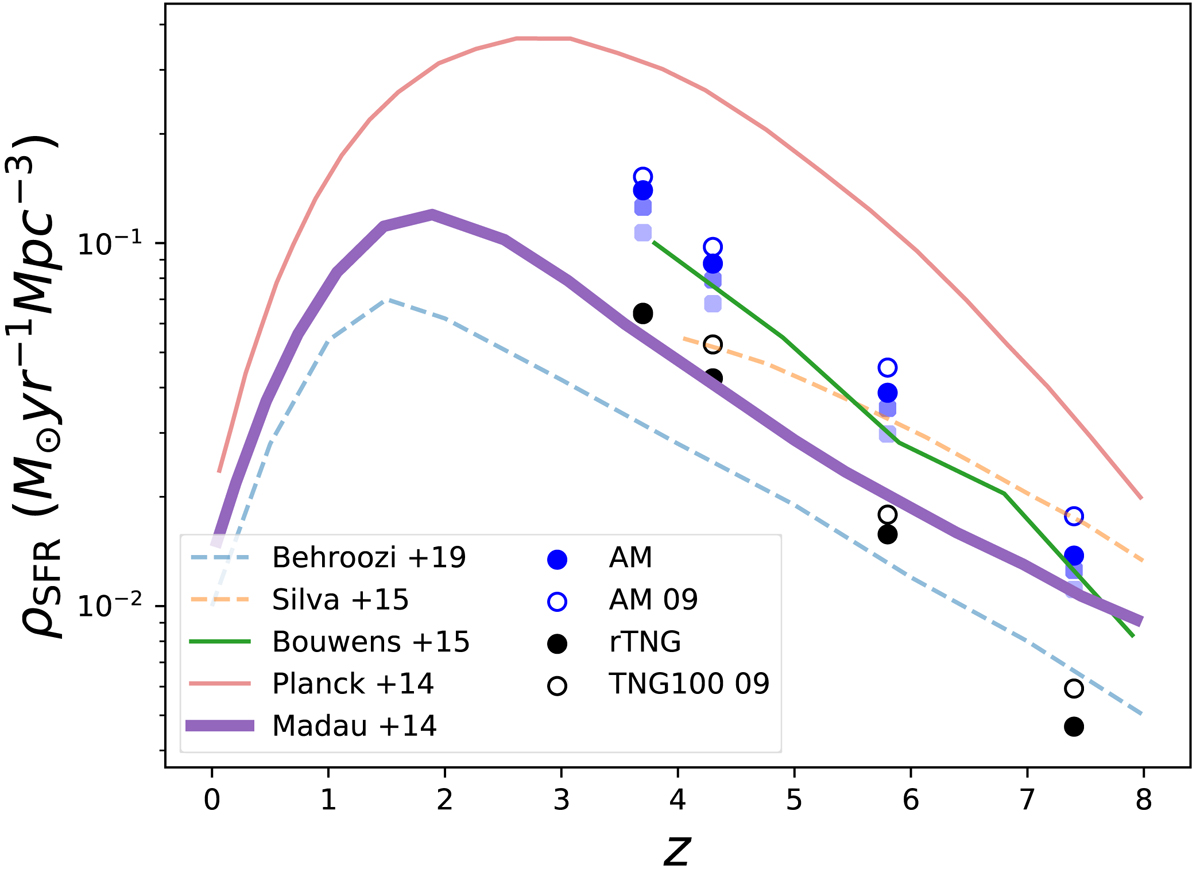
Fig. 3.
Download original image
Redshift evolution of the cosmic SFRD as inferred from our rTNG (black dots) and AM (dark blue dots) models. Our AM results are also presented for a slightly different dust correction similar to that used in Bouwens et al. (2015, blue dots) and for a cone catalog restricted to galaxies not brighter than the brightest SF galaxies observed in the pencil-beam survey of Bouwens et al. (2015, light blue dots). The empty blue and black circles is our AM and TNG100 prediction for the lower halo mass limit of Mh = 3 × 10⁹ M⊙. The solid green, red, and purple lines present observational constraints from Bouwens et al. (2015), Planck Collaboration XXX (2014), and Madau & Dickinson (2014), respectively. The dashed blue line is the UNIVERSE Machine prediction (Behroozi et al. 2019) and the dashed orange line is the SFRD that comes from analytically integrating the Mh-to-SFR relation of Silva et al. (2015) over all halo masses.
Current usage metrics show cumulative count of Article Views (full-text article views including HTML views, PDF and ePub downloads, according to the available data) and Abstracts Views on Vision4Press platform.
Data correspond to usage on the plateform after 2015. The current usage metrics is available 48-96 hours after online publication and is updated daily on week days.
Initial download of the metrics may take a while.