Fig. 1.
Download original image
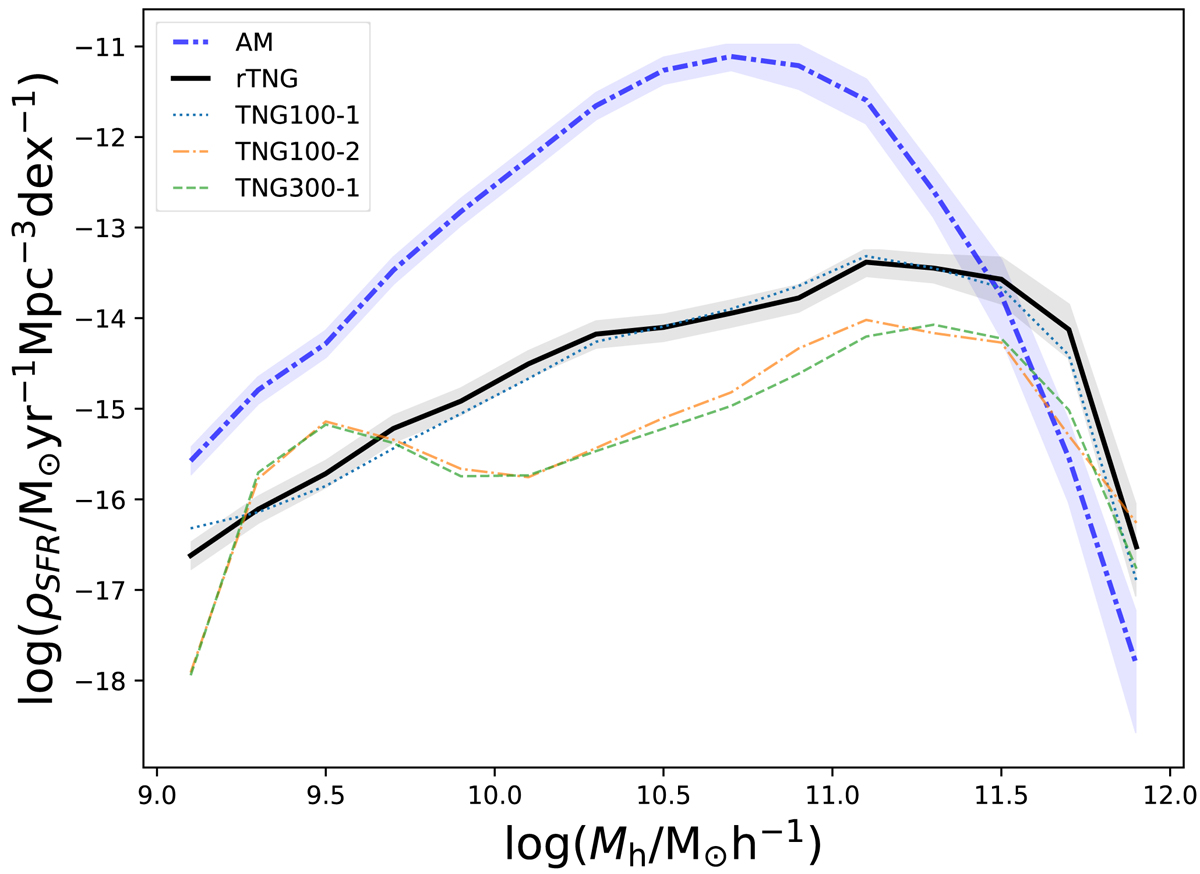
Contribution of different halo mass range to the cosmic comoving star formation rate density at z = 5.8. The dotted blue, long-dash-dotted orange, and dashed green lines are inferred from the TNG100-1, TNG100-2, and TNG300-1 simulations, respectively. The solid black line is inferred from the renormalized TNG300-1 simulation (rTNG), according to Eq. (1). The dash-dotted light blue line is inferred by abundance matching (AM) our TNG300-1-based DM halo cone to the dust-corrected UV luminosity function of Bouwens et al. (2015, see Sect. 2.2.2). Gray and blue shaded areas are the 68% confidence integrals for rTNG and AM results, respectively, taking into account both the effects of the Poisson error and the sample variance.
Current usage metrics show cumulative count of Article Views (full-text article views including HTML views, PDF and ePub downloads, according to the available data) and Abstracts Views on Vision4Press platform.
Data correspond to usage on the plateform after 2015. The current usage metrics is available 48-96 hours after online publication and is updated daily on week days.
Initial download of the metrics may take a while.