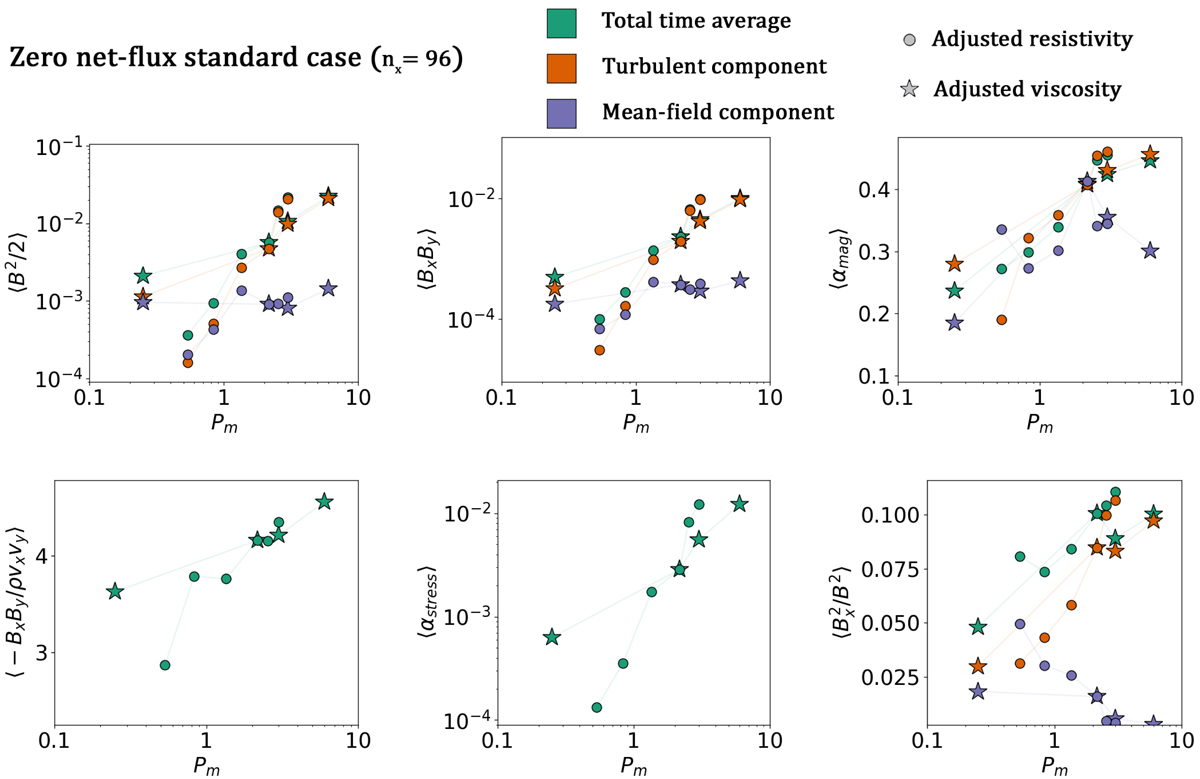
Fig. 8.
Download original image
Time-averaged values of several quantities for all our unstratified, zero net-flux simulations with standard box size (L = [1.0, π, 4.0]) and resolution nx = 96. From the top left to bottom right: magnetic energy density, Maxwell stress, normalized Maxwell stress, ratio between Reynolds and Maxwell stresses, total stress, ratio between radial and total magnetic field energy. The x-axis shows the time-averaged effective Prandtl number of the simulation. For some quantities we have plotted the total time average (shown in green), the time average of the turbulent component (shown in orange) and the time average of the mean component (shown in blue). The circles represent the simulations where we have adjusted the strength of the artificial resistivity, while the star symbols represent the simulations where we have adjusted the artificial viscosity.
Current usage metrics show cumulative count of Article Views (full-text article views including HTML views, PDF and ePub downloads, according to the available data) and Abstracts Views on Vision4Press platform.
Data correspond to usage on the plateform after 2015. The current usage metrics is available 48-96 hours after online publication and is updated daily on week days.
Initial download of the metrics may take a while.