Fig. 4.
Download original image
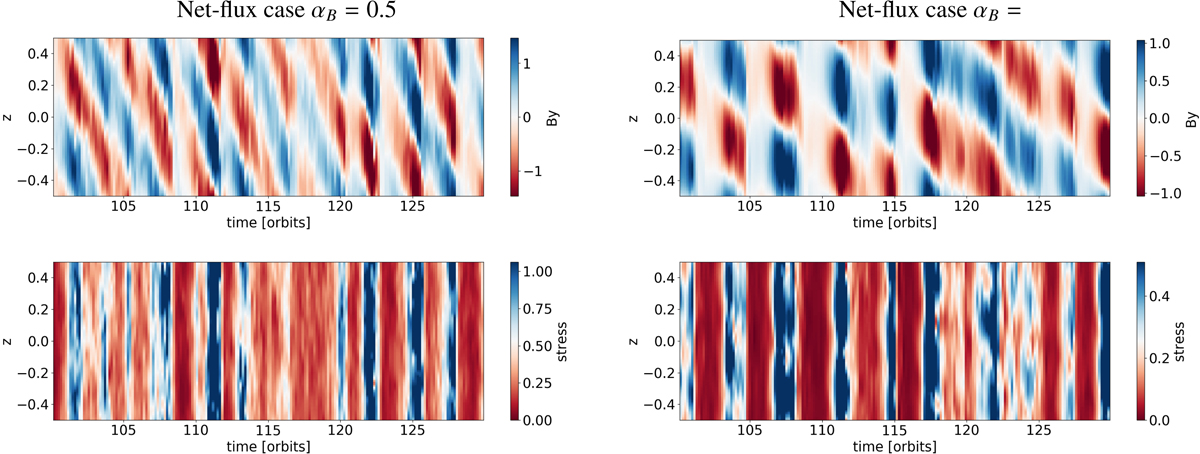
Spacetime diagrams showing the azimuthal magnetic field at the top and the total stress at the bottom. The left figures shows the simulation with an artificial resistivity coefficient αB = 0.5 and the right figures show the simulation with αB = 4. The figures clearly show the peaks related to the continuous creation and destruction of channel modes. Increasing the resistivity leads to a suppression of small scale magnetic fluctuation, and this means that more of the stress will be generated by the mean-field component.
Current usage metrics show cumulative count of Article Views (full-text article views including HTML views, PDF and ePub downloads, according to the available data) and Abstracts Views on Vision4Press platform.
Data correspond to usage on the plateform after 2015. The current usage metrics is available 48-96 hours after online publication and is updated daily on week days.
Initial download of the metrics may take a while.