Fig. 21.
Download original image
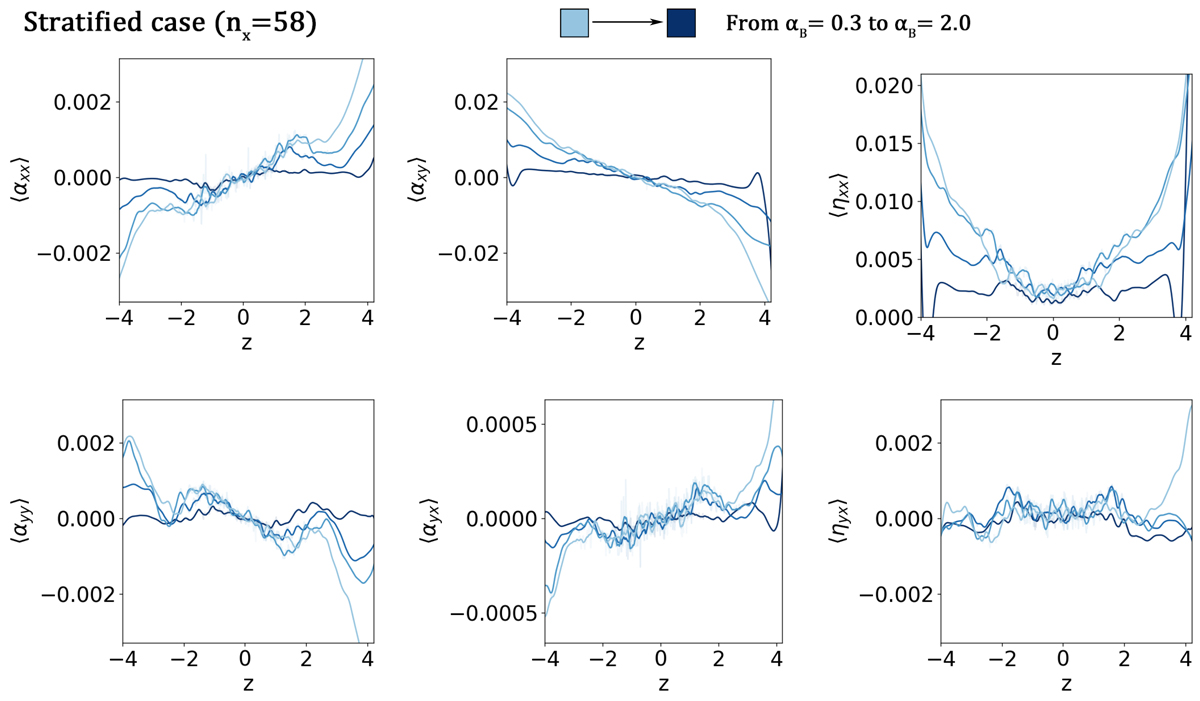
Horizontal time-averaged turbulent transport coefficient in the z direction from the stratified net-flux cases. The darkness of the curves is determined by the strength of the artificial resistivity parameter, αB = 0.3, 0.5, 1.0, 2.0. We can see that we have a negative αyy effect that is negative (positive) in the top (bottom) half of the box. This enables the αω-dynamo to operate efficiently within the central region. αxx on the other hand has a positive gradient and will act against the shear term. Turbulent pumping advects magnetic fields outwards from the central region with velocity ![]() . However, the αxy magnitudes differ significantly to what is expected, which is likely caused by correlations with
. However, the αxy magnitudes differ significantly to what is expected, which is likely caused by correlations with ![]() due to the shear term as explained in Sect. 2.1. In the central region we find that at all resistivities we have a positive value for ηxx and ηyx, which is similar to our result of the unstratified case. In general we find that the behavior of the transport coefficients are similar to previous simulations of the stratified MRI (Brandenburg et al. 1995b; Brandenburg & Sokoloff 2002; Brandenburg 2008; Shi et al. 2016; Gressel 2010).
due to the shear term as explained in Sect. 2.1. In the central region we find that at all resistivities we have a positive value for ηxx and ηyx, which is similar to our result of the unstratified case. In general we find that the behavior of the transport coefficients are similar to previous simulations of the stratified MRI (Brandenburg et al. 1995b; Brandenburg & Sokoloff 2002; Brandenburg 2008; Shi et al. 2016; Gressel 2010).
Current usage metrics show cumulative count of Article Views (full-text article views including HTML views, PDF and ePub downloads, according to the available data) and Abstracts Views on Vision4Press platform.
Data correspond to usage on the plateform after 2015. The current usage metrics is available 48-96 hours after online publication and is updated daily on week days.
Initial download of the metrics may take a while.