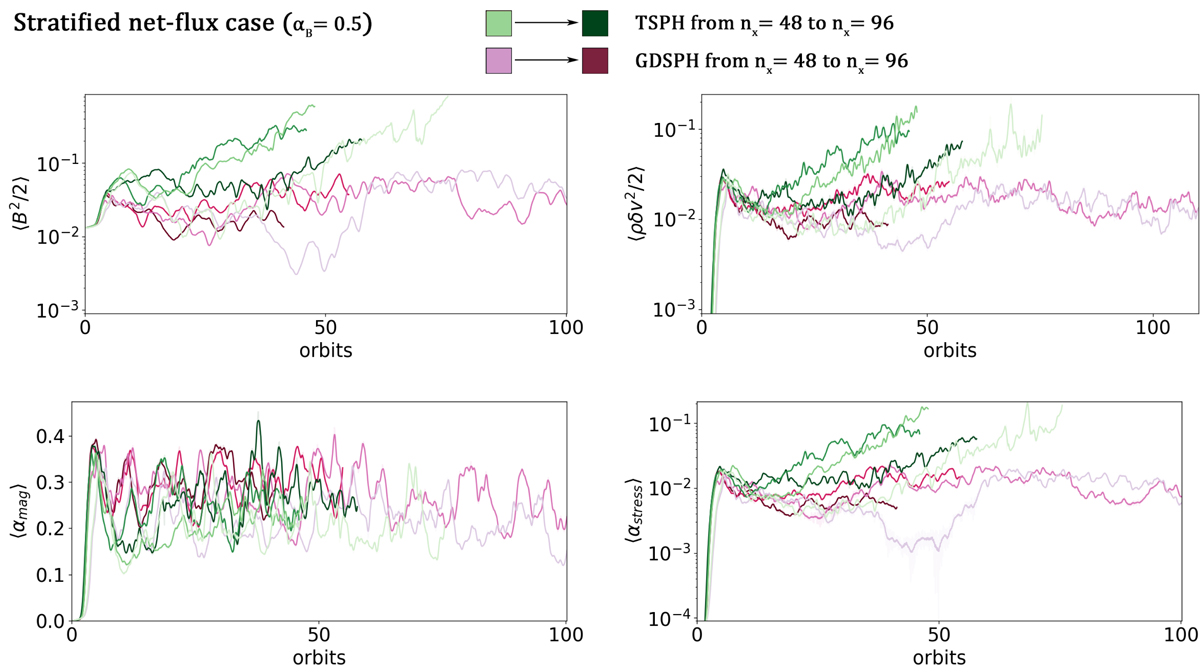
Fig. 19.
Download original image
Time evolution of several volume averaged quantities for the stratified net-flux simulations with varying resolution (nx = [48, 58, 74, 93]) and the artificial resistivity coefficient set to αB = 0.5. Magnetic energy (top left), kinetic energy (top right), normalized Maxwell stress (bottom left) and the total stress (bottom right). The green lines show the simulations run with TSPH and purple lines show the runs with GDSPH. The darkness of the line indicate the resolution, where the darkest line represents the highest resolution.
Current usage metrics show cumulative count of Article Views (full-text article views including HTML views, PDF and ePub downloads, according to the available data) and Abstracts Views on Vision4Press platform.
Data correspond to usage on the plateform after 2015. The current usage metrics is available 48-96 hours after online publication and is updated daily on week days.
Initial download of the metrics may take a while.