Fig. 16.
Download original image
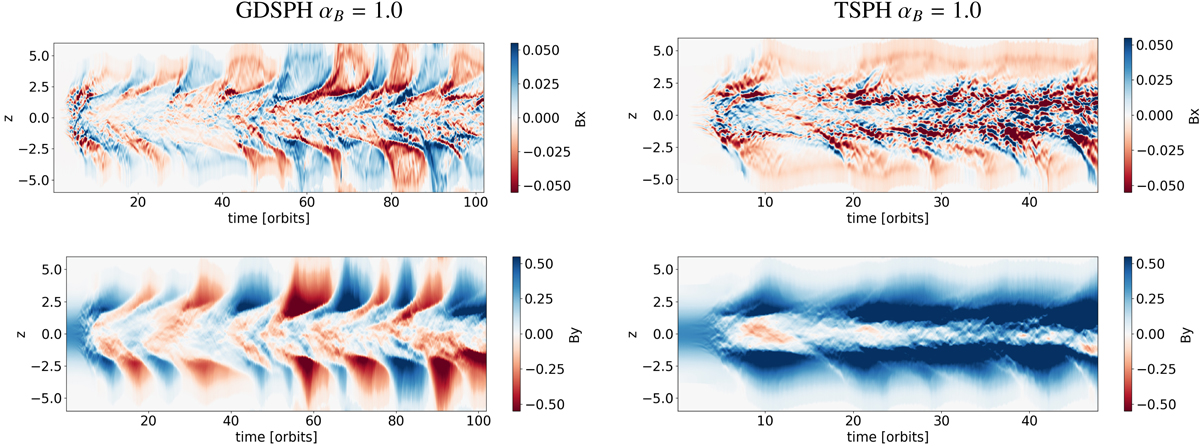
Spacetime diagrams of the stratified net flux simulations, showing the evolution of the horizontal averaged radial (top) and azimuthal (bottom) fields for both GDSPH (left) and TSPH (right) in the case of αB = 1 with a resolution nx = 58. At this resistivity only GDSPH reproduce the butterfly diagram, where for TSPH a strong positive azimuthal field permeates the disk corona (|z|> 2). The azimuthal field is additionally amplified as the simulation goes on and starts to propagate into the central disk region.
Current usage metrics show cumulative count of Article Views (full-text article views including HTML views, PDF and ePub downloads, according to the available data) and Abstracts Views on Vision4Press platform.
Data correspond to usage on the plateform after 2015. The current usage metrics is available 48-96 hours after online publication and is updated daily on week days.
Initial download of the metrics may take a while.