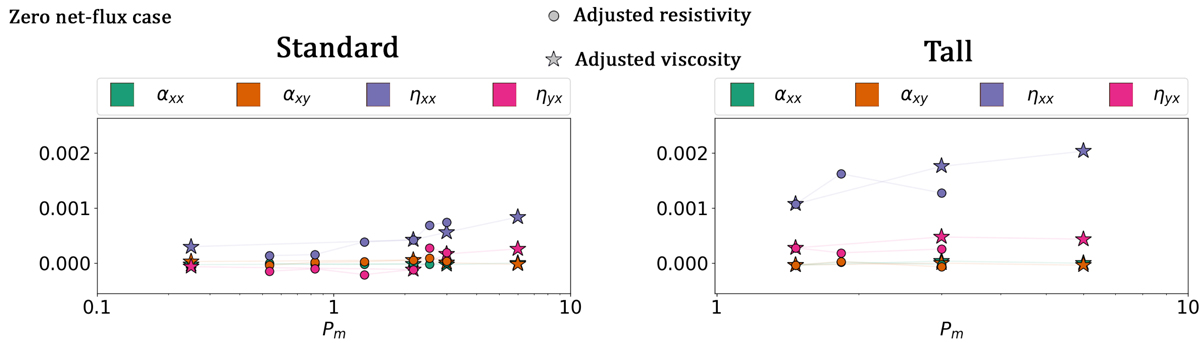
Fig. 13.
Download original image
Time-averaged turbulent transport coefficients from the unstratified, zero net-flux cases, with the standard box size cases (L = [1.0, π, 1.0], nx = 96) to the left and the tall box cases (L = [1.0, π, 4.0], nx = 48) to the right. The circles represent the simulations where we have adjusted the strength of the artificial resistivity, while the star symbols represent the simulations where we have adjusted the artificial viscosity. To minimize noise we have set αxx = αyy, ηxx = ηyy, αyx = 0.0 and ηxy = 0.0. We can see that the α coefficients have values of around zero as expected for the unstratified case and ηxx with a consistent positive value. For the standard box ηyx remain close to zero while for the tall box we see a consistent positive value which is contrary to what was seen by Shi et al. (2016).
Current usage metrics show cumulative count of Article Views (full-text article views including HTML views, PDF and ePub downloads, according to the available data) and Abstracts Views on Vision4Press platform.
Data correspond to usage on the plateform after 2015. The current usage metrics is available 48-96 hours after online publication and is updated daily on week days.
Initial download of the metrics may take a while.