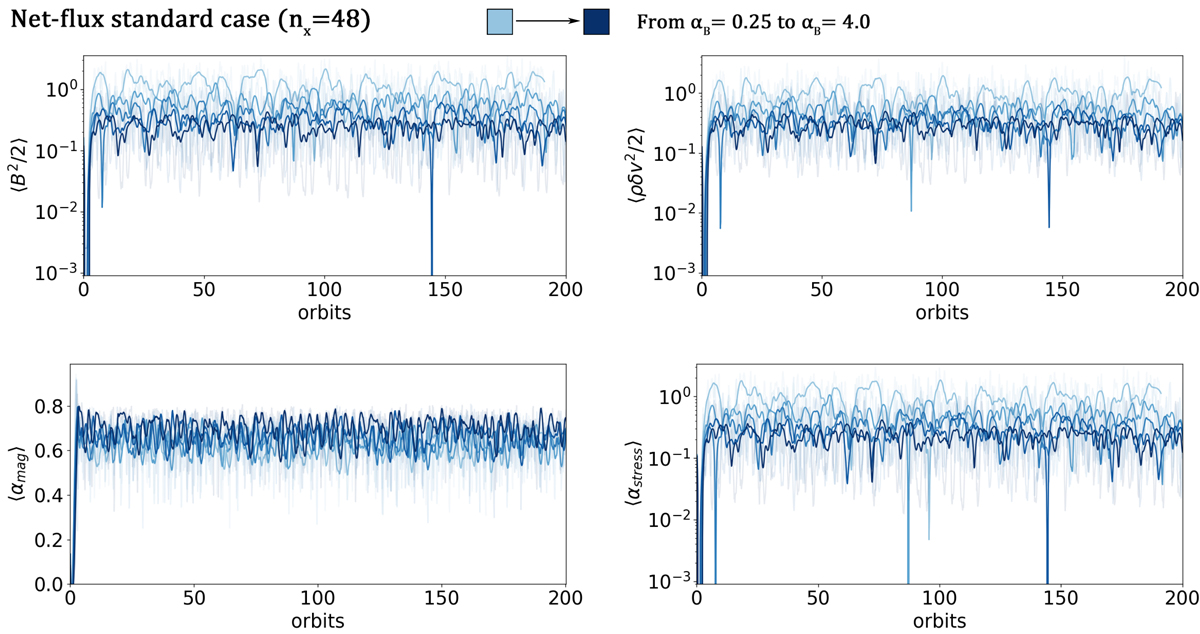
Fig. 1.
Download original image
Time evolution of several volume-averaged quantities over 200 orbits. Magnetic energy (top left), kinetic energy (top right), normalized Maxwell stress (bottom left) and the total stress (bottom right). The darkness of the curves is determined by the strength of the artificial resistivity parameter, αB = 0.25, 0.5, 1.0, 2.0, 4.0. Due to the high oscillatory nature of the simulation we have smoothed the curves using a Savitzky–Golay filter, the unsmoothed curves can still be seen as very transparent curves. The oscillations are related to the formation and destruction of channel modes.
Current usage metrics show cumulative count of Article Views (full-text article views including HTML views, PDF and ePub downloads, according to the available data) and Abstracts Views on Vision4Press platform.
Data correspond to usage on the plateform after 2015. The current usage metrics is available 48-96 hours after online publication and is updated daily on week days.
Initial download of the metrics may take a while.