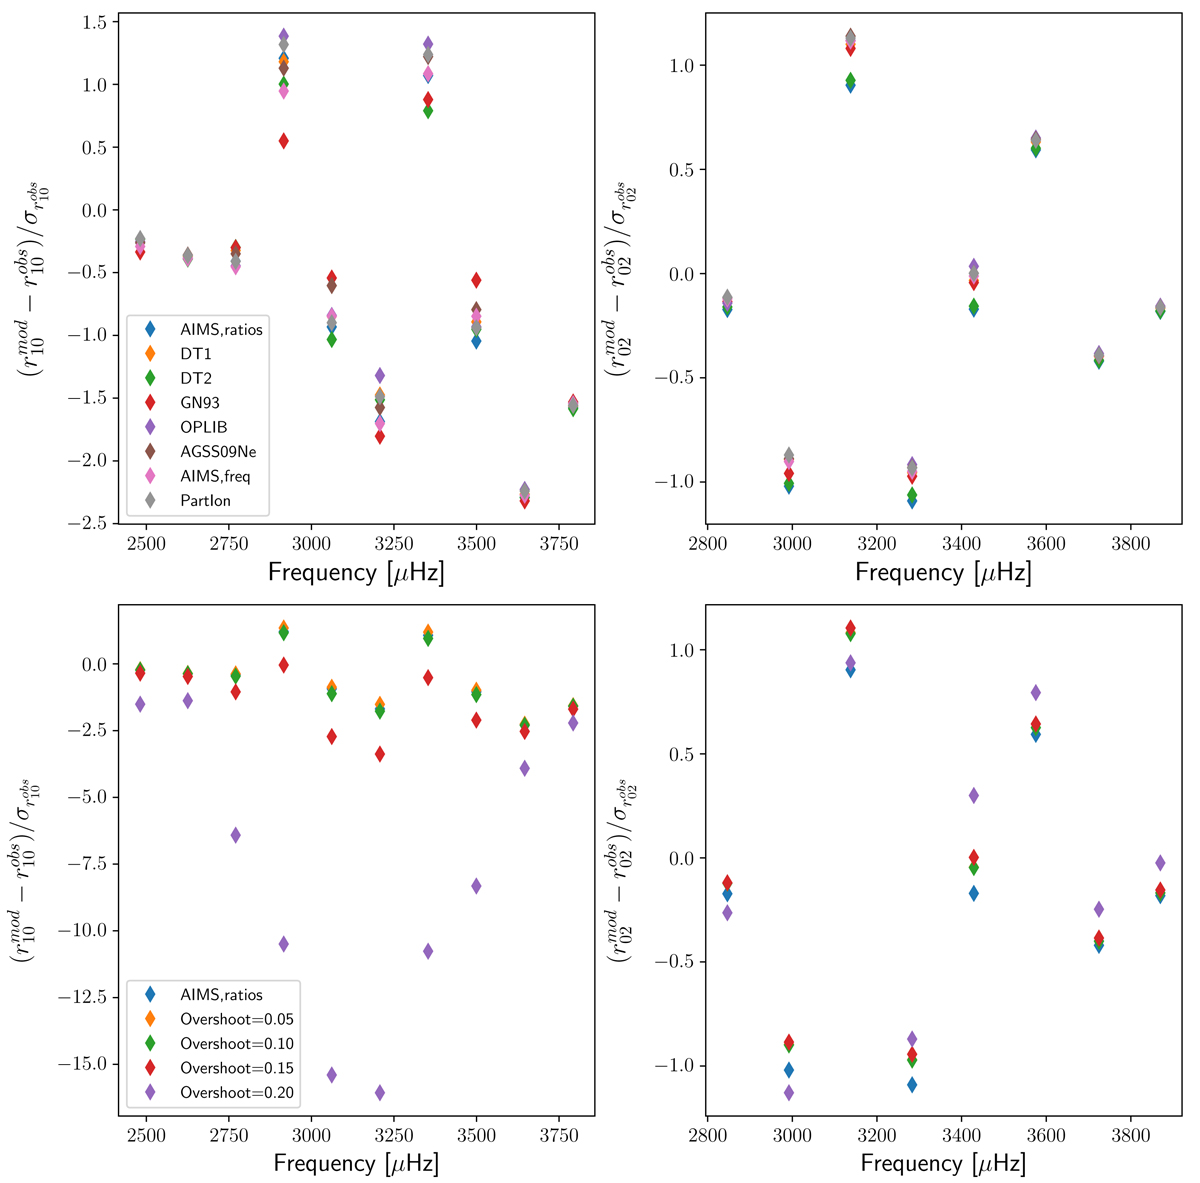
Fig. 5.
Download original image
Comparison of the models with different physical ingredients. Upper panel: comparison of the r10 (left) and r02 (right) frequency ratios obtained by varying the physical ingredients and without overshoot. The model with the GN93 abundances stands out slightly. Lower panel: comparison of the r10 (left) and r02 (right) frequency ratios obtained by varying the overshoot parameter. The model labelled AIMS, ratios is without overshoot. There is no visible difference between the blue and orange symbols in the lower left panel. Orange and green symbols are also largely superimposed in the lower right panel.
Current usage metrics show cumulative count of Article Views (full-text article views including HTML views, PDF and ePub downloads, according to the available data) and Abstracts Views on Vision4Press platform.
Data correspond to usage on the plateform after 2015. The current usage metrics is available 48-96 hours after online publication and is updated daily on week days.
Initial download of the metrics may take a while.