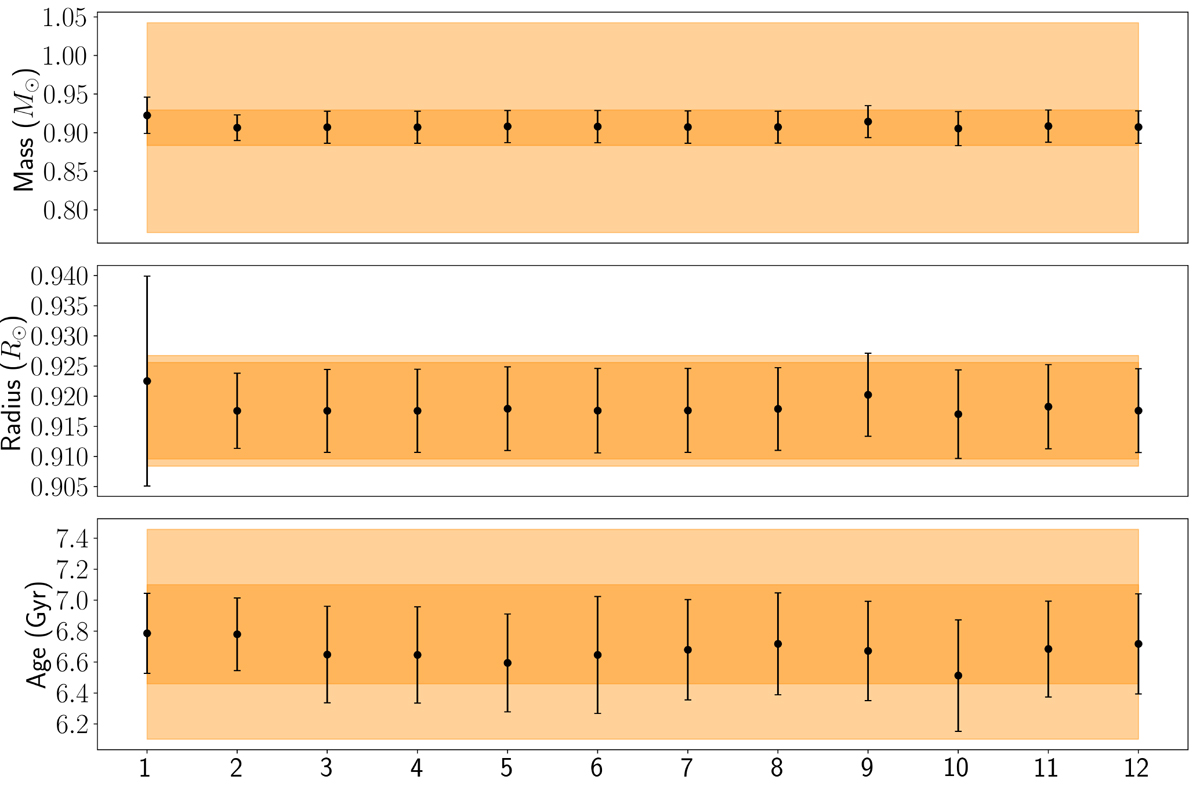
Fig. 4.
Download original image
Graphical visualisation of Table 2. The numbers i of the x-axis should be read as model i. From top to bottom: mass, radius, and age of the different models. The dark orange band indicates the final 1σ-interval (cf. Table 3) and the light orange band the precision requirements of PLATO (15% in mass, 1−2% in radius, and 10% in age). The optimal stellar parameters are well within the PLATO precision requirements.
Current usage metrics show cumulative count of Article Views (full-text article views including HTML views, PDF and ePub downloads, according to the available data) and Abstracts Views on Vision4Press platform.
Data correspond to usage on the plateform after 2015. The current usage metrics is available 48-96 hours after online publication and is updated daily on week days.
Initial download of the metrics may take a while.