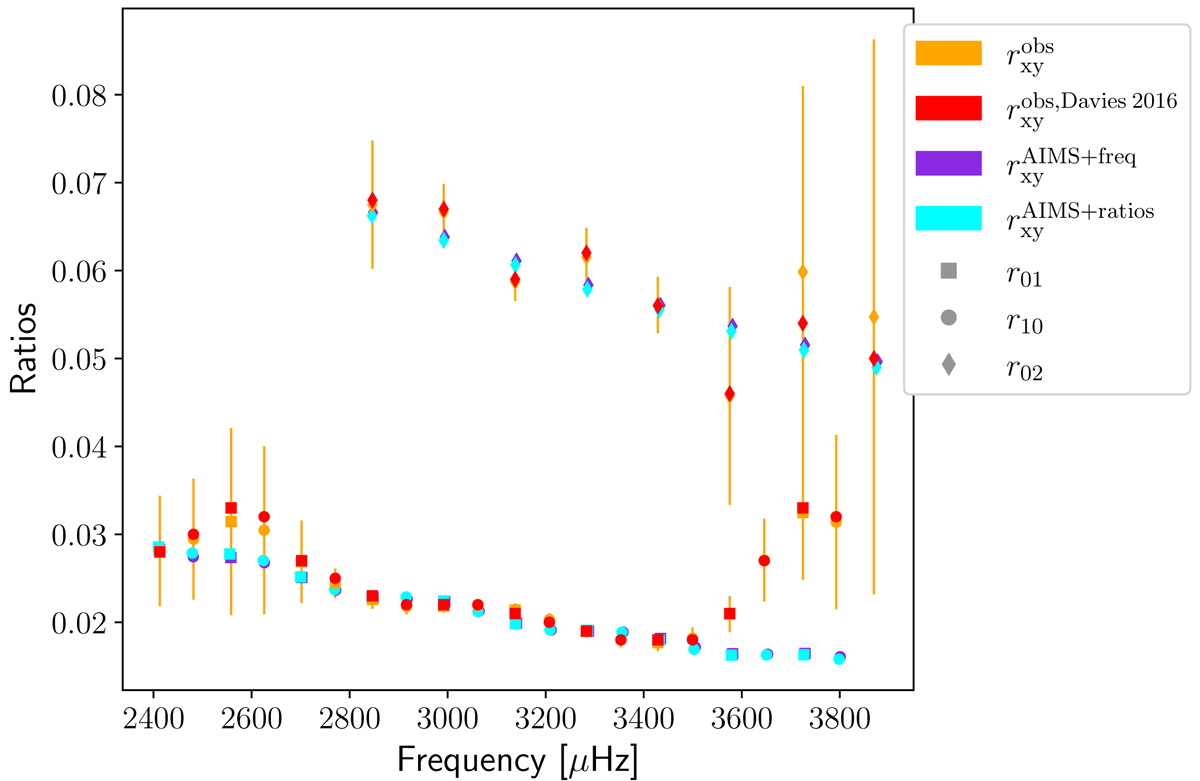
Fig. 3.
Download original image
Observed and modelled frequency ratios r01, r10, and r02 of Kepler-93. In red we plot the ratios computed by Davies et al. (2016) without error bars for readability reasons. These errors are similar to those found in this work. The observed ratios of our study (orange) are computed with the definitions of Roxburgh & Vorontsov (2003), while the ratios from Davies et al. (2016) come from their fitting procedure. The modelled ratios are plotted in purple for the fit of the frequencies and in cyan for the fit of the ratios. The bump at the right of the plot for the r01 and r10 ratios is likely due to surface activity during the measurement.
Current usage metrics show cumulative count of Article Views (full-text article views including HTML views, PDF and ePub downloads, according to the available data) and Abstracts Views on Vision4Press platform.
Data correspond to usage on the plateform after 2015. The current usage metrics is available 48-96 hours after online publication and is updated daily on week days.
Initial download of the metrics may take a while.