Fig. 4.
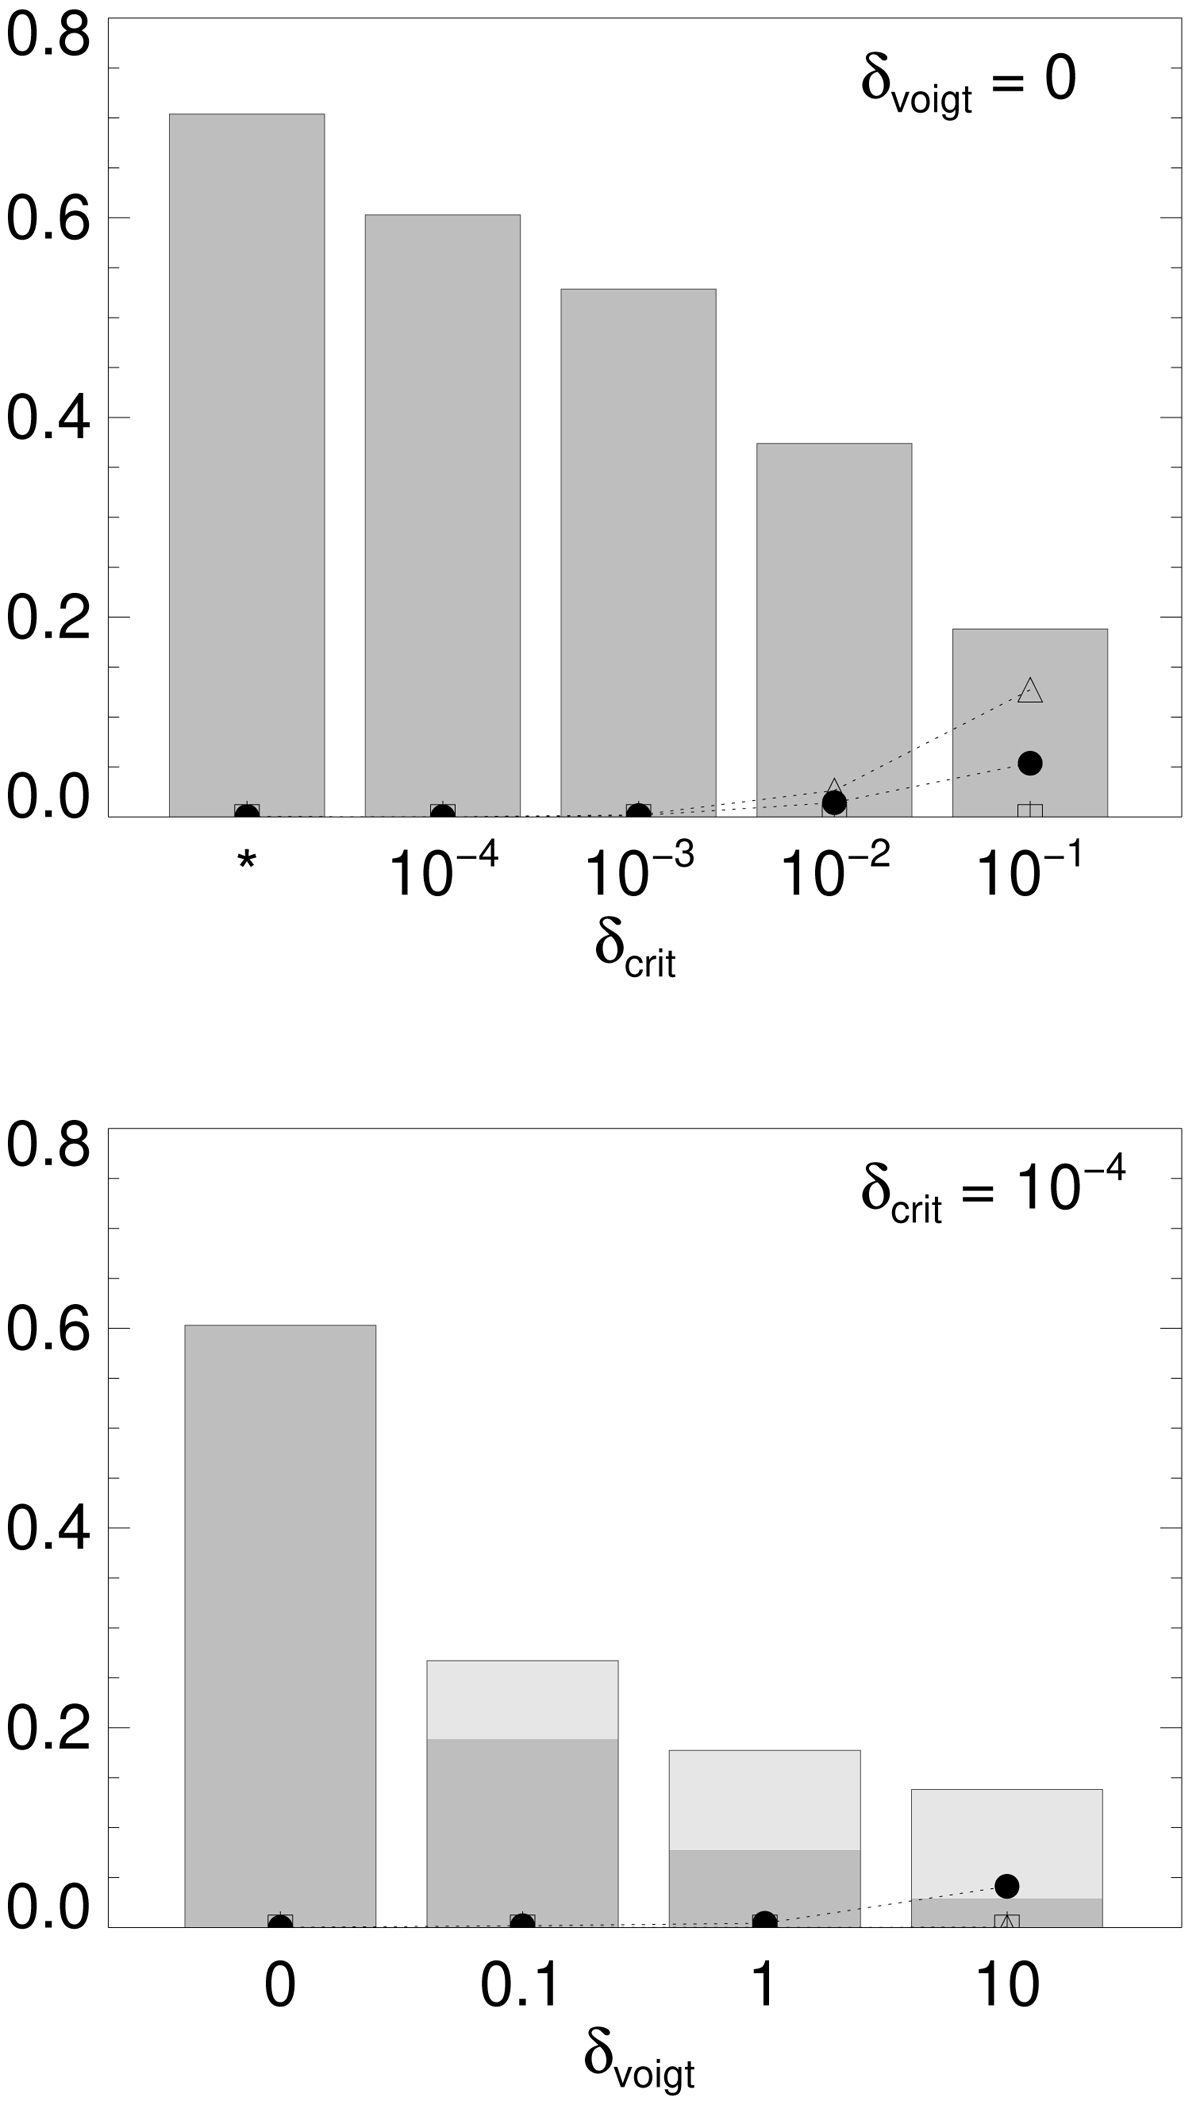
Download original image
Relative number of the Voigt lines (gray bar) (as well as that of Gauss lines; light gray bar) against the total number of lines in the reference case (δvoigt = δcrit = 0). Also, relative errors of the Rosseland (triangle) and Planck (square) mean opacity as well as of the monochromatic absorption coefficient (filled circle) are plotted. The CE abundance data used here are taken from the first layer of a demo output produced by FASTCHEM, chem_output_agb_stellar_wind.dat. The asterisk in the upper panel indicates a run that employs HITRAN’s dynamic strength cutoff, instead of δcrit.
Current usage metrics show cumulative count of Article Views (full-text article views including HTML views, PDF and ePub downloads, according to the available data) and Abstracts Views on Vision4Press platform.
Data correspond to usage on the plateform after 2015. The current usage metrics is available 48-96 hours after online publication and is updated daily on week days.
Initial download of the metrics may take a while.