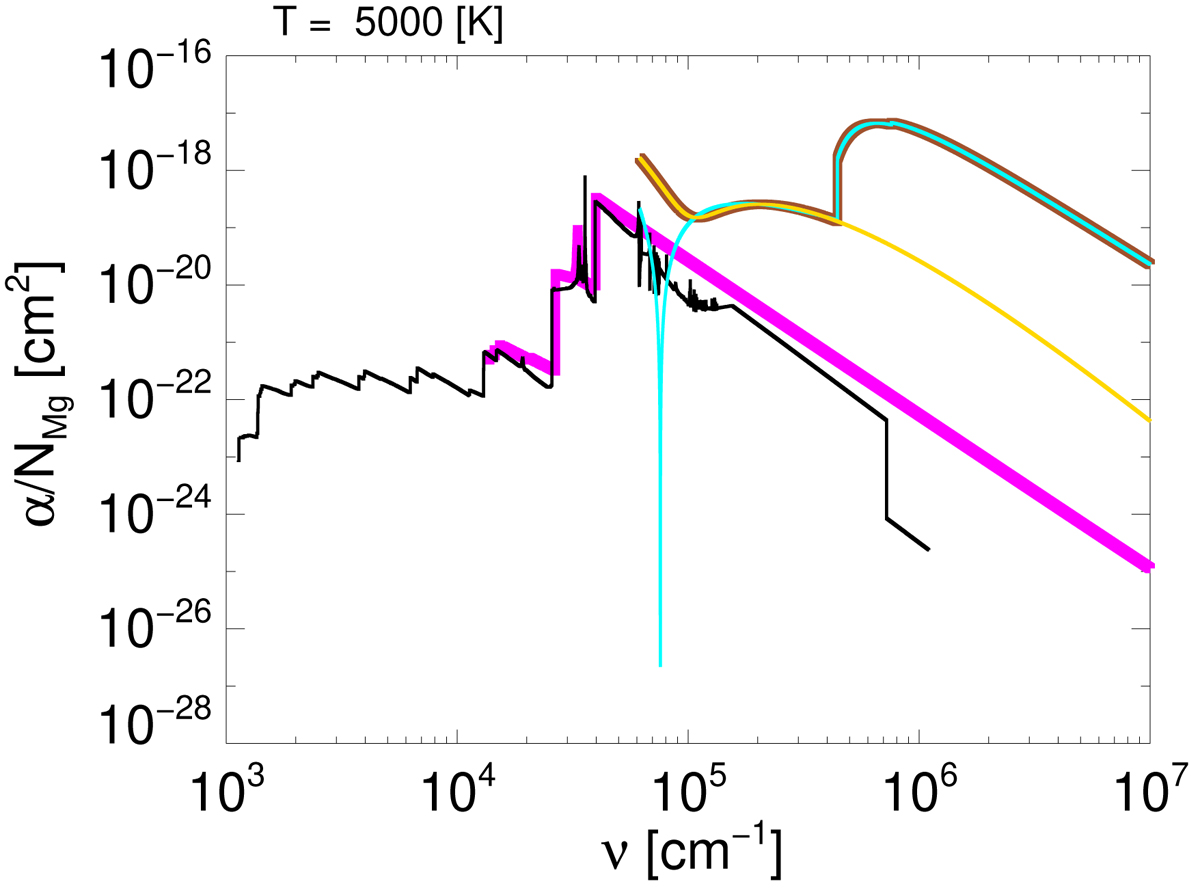
Fig. 2.
Download original image
Magnesium photoionization absorption coefficients per Mg atom [cm2] at 5000 K. The brown curve indicates the photoionization from the ground level, and is a hybrid of Verner et al. (1996) (outer-subshell contributions; yellow) and Verner & Yakovlev (1995) (inner-subshell contributions; cyan). Both the magenta and black thin curves indicate the photoionization from excited levels; the former is based on the Mathisen (1984) compilation, whereas the latter is based on TOPbase.
Current usage metrics show cumulative count of Article Views (full-text article views including HTML views, PDF and ePub downloads, according to the available data) and Abstracts Views on Vision4Press platform.
Data correspond to usage on the plateform after 2015. The current usage metrics is available 48-96 hours after online publication and is updated daily on week days.
Initial download of the metrics may take a while.