Fig. 2
Download original image
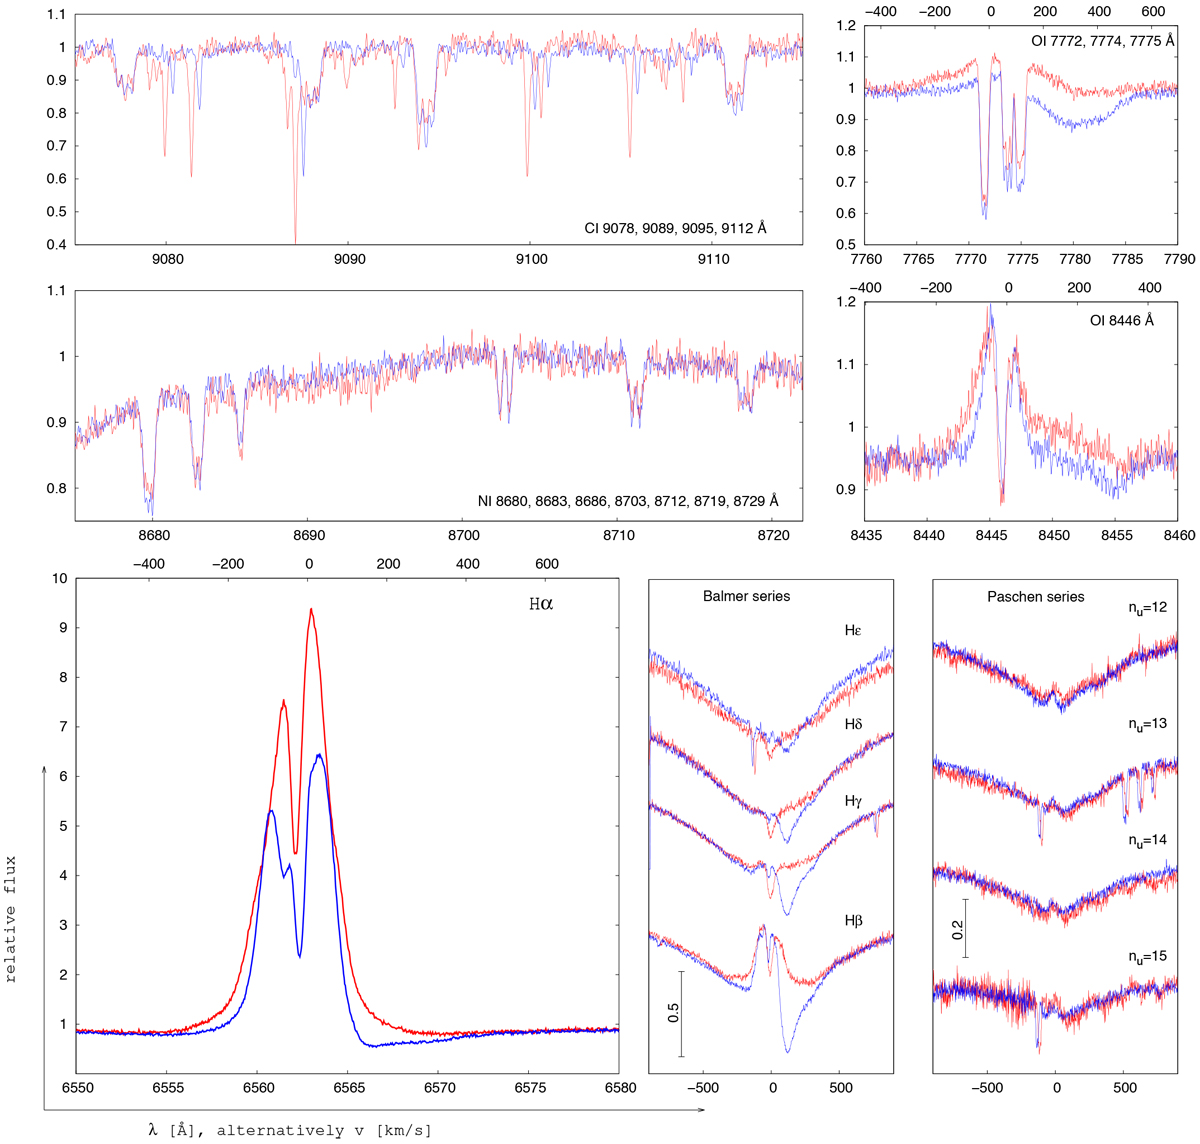
Comparison of the selected parts of the spectra for phases showing the red-shifted absorption (CFHT 2012-02-09, blue lines) and a regular spectrum (CFHT 2006-06-08, red lines). The spectra are corrected on system velocity determined based on the position of [O I] lines. The area with C I multiplet is contaminated by the atmospheric lines.
Current usage metrics show cumulative count of Article Views (full-text article views including HTML views, PDF and ePub downloads, according to the available data) and Abstracts Views on Vision4Press platform.
Data correspond to usage on the plateform after 2015. The current usage metrics is available 48-96 hours after online publication and is updated daily on week days.
Initial download of the metrics may take a while.