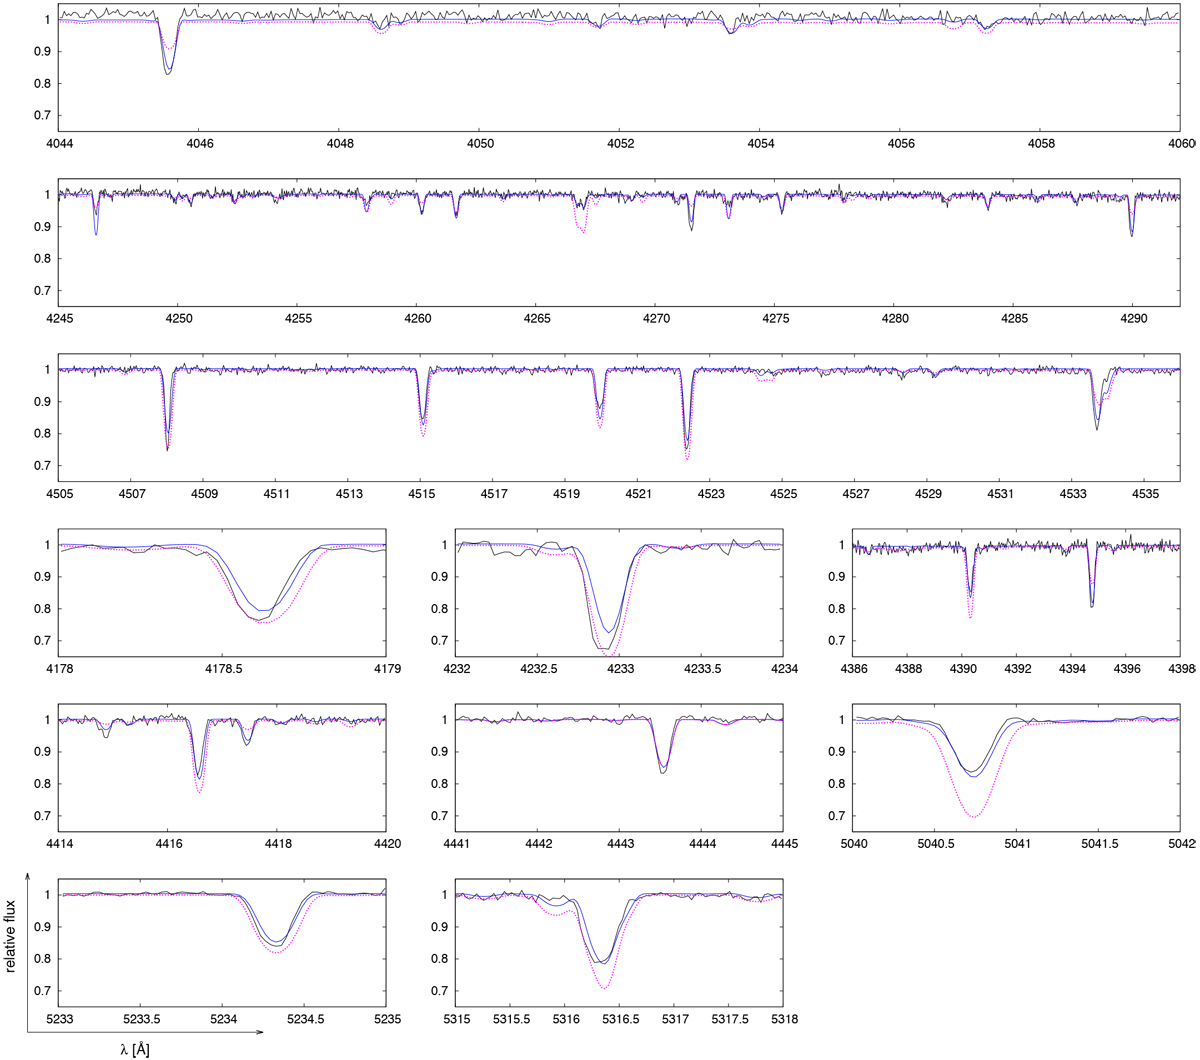
Fig. A.10
Download original image
Spectral fitting. The observed spectrum is plotted by the black line, the blue one is the best fit using PYTERPOL code (see Table 4), for which the contribution of the hot source was included into the calculations. For the comparison, we also show the best fit by a single star (Teff = 12 580 K, log g =4.2, and vrot =11 km s−1, solar composition) without the contribution of a hot source, the dotted violet line.
Current usage metrics show cumulative count of Article Views (full-text article views including HTML views, PDF and ePub downloads, according to the available data) and Abstracts Views on Vision4Press platform.
Data correspond to usage on the plateform after 2015. The current usage metrics is available 48-96 hours after online publication and is updated daily on week days.
Initial download of the metrics may take a while.