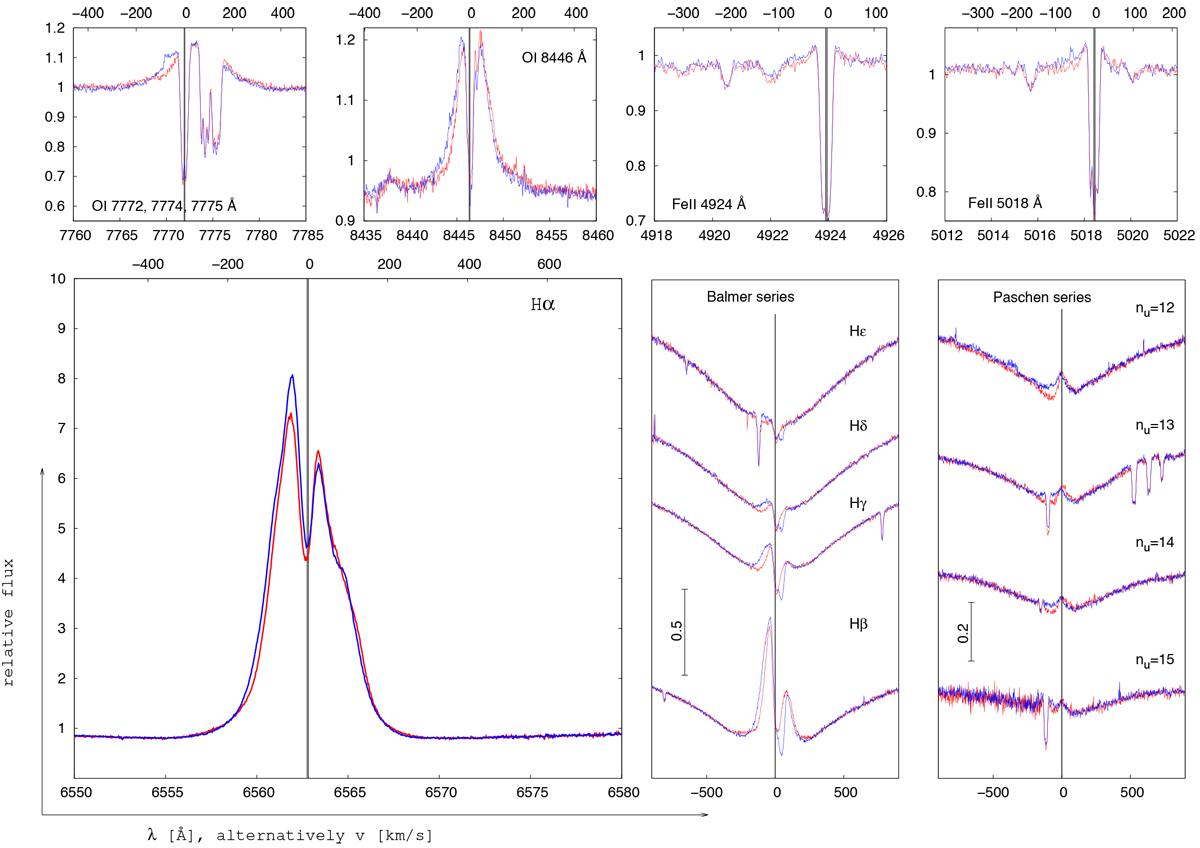
Fig. A.6
Download original image
Night-to-night changes demonstrated on the spectra taken at CFHT on 2012-08-13 and 2012-08-14. Significant changes are shown only in the hydrogen and oxygen lines. Also shown to be slightly different is the blue wing of the Fe II lines 4 924, and 5 018 Å lines. Other lines do not show night-to-night variations. The spectra are corrected on the system radial velocity. The laboratory wavelength connected with the system is plotted by the vertical grey line and its thickness corresponds to its error.
Current usage metrics show cumulative count of Article Views (full-text article views including HTML views, PDF and ePub downloads, according to the available data) and Abstracts Views on Vision4Press platform.
Data correspond to usage on the plateform after 2015. The current usage metrics is available 48-96 hours after online publication and is updated daily on week days.
Initial download of the metrics may take a while.