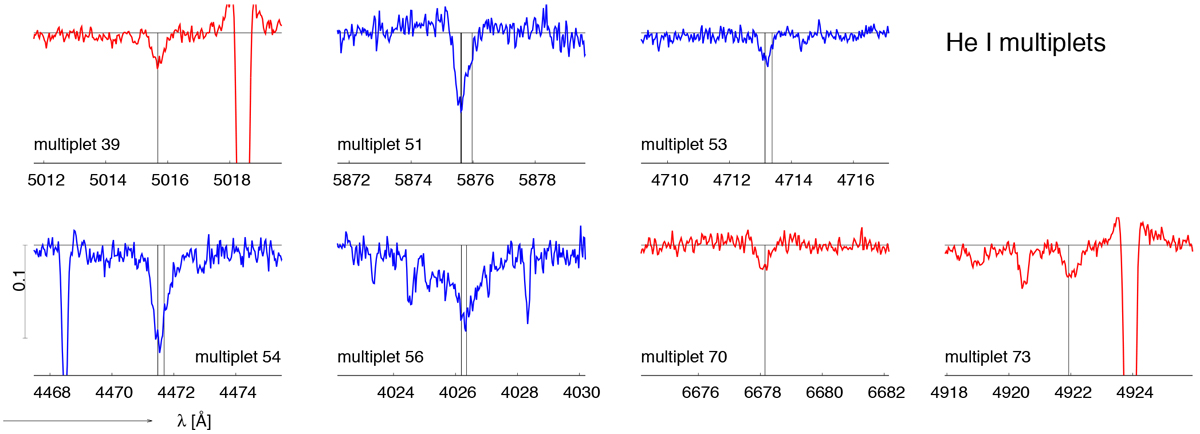
Fig. A.4
Download original image
Position, strength, and shape of He I lines. The vertical lines denote the central wavelength of the lines and the horizontal line the position of the continuum. The color distinguishes the singlet (red) and triplets (blue) states. All spectral lines are plotted on the same scale, which suppresses the strength of the emission wings of He I 5 876 and 6 678 Å lines. We note that the continuum normalization was carried out very carefully.
Current usage metrics show cumulative count of Article Views (full-text article views including HTML views, PDF and ePub downloads, according to the available data) and Abstracts Views on Vision4Press platform.
Data correspond to usage on the plateform after 2015. The current usage metrics is available 48-96 hours after online publication and is updated daily on week days.
Initial download of the metrics may take a while.