Fig. 6.
Download original image
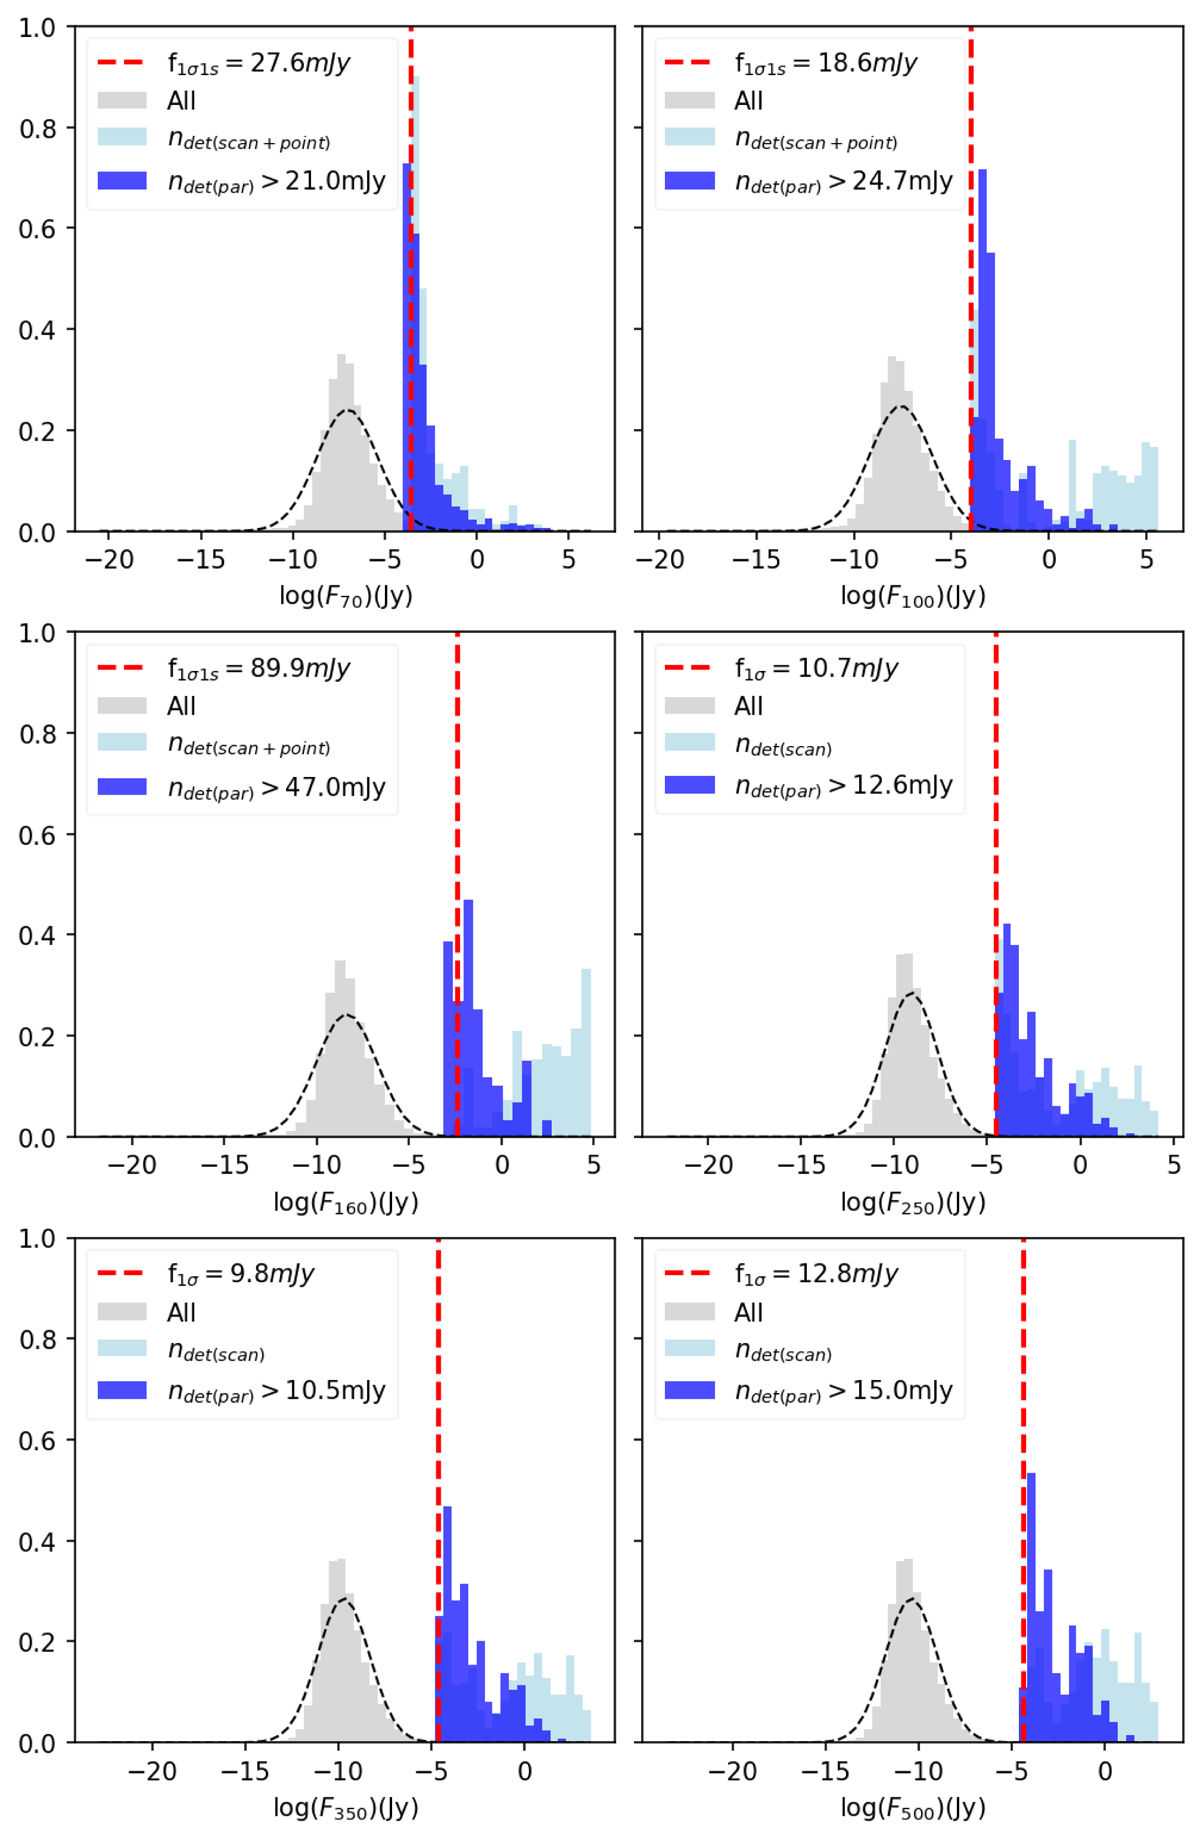
Theoretical infrared flux distribution of geometrical cross-matches for all Herschel bands and fixed input albedo, beaming and emissivity parameters. From top to bottom and left to right: 70, 100, 160, 250, 350, and 500 μm normalized flux distribution in grey. Red-dashed line marks the estimated flux sensitivity limit per band. The subset detections above flux sensitivity are displayed in blue.
Current usage metrics show cumulative count of Article Views (full-text article views including HTML views, PDF and ePub downloads, according to the available data) and Abstracts Views on Vision4Press platform.
Data correspond to usage on the plateform after 2015. The current usage metrics is available 48-96 hours after online publication and is updated daily on week days.
Initial download of the metrics may take a while.