Fig. 14.
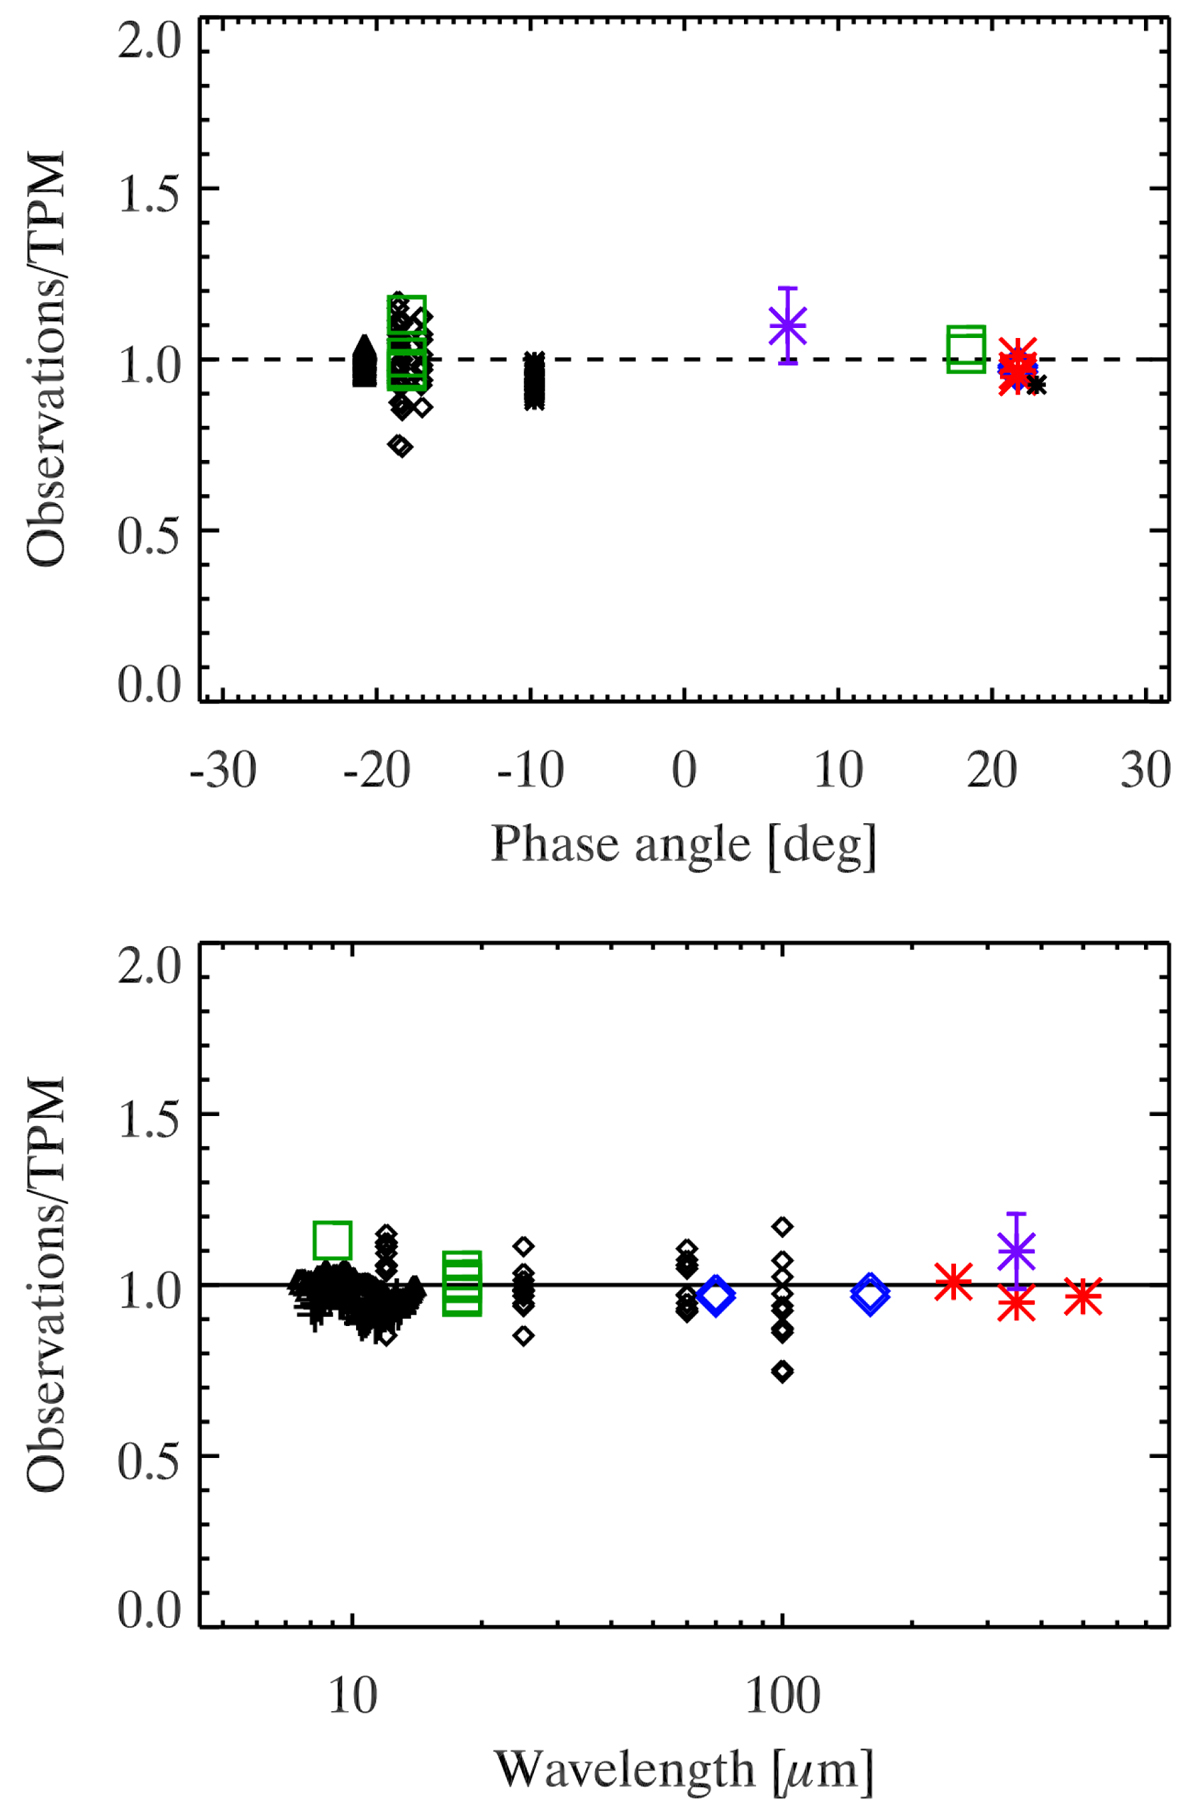
Download original image
Thermal observations of Psyche divided by the corresponding thermophysical model predictions (using our best solution as given in the text). The new measurements are shown in color: green for the AKARI measurements, blue for the PACS, red for the SPIRE, and purple for the CSO data. The IRAS data are shown as diamonds, the Spitzer-IRS data as triangles, and the WISE data as plus symbols. Top figure: observation-to-model ratios as a function of phase angle (sensitive to thermal inertia) and the bottom figure shows it as function of wavelengths (sensitive to surface roughness and emissivity). Wrong settings in the model would show up as trends and slopes in these plots.
Current usage metrics show cumulative count of Article Views (full-text article views including HTML views, PDF and ePub downloads, according to the available data) and Abstracts Views on Vision4Press platform.
Data correspond to usage on the plateform after 2015. The current usage metrics is available 48-96 hours after online publication and is updated daily on week days.
Initial download of the metrics may take a while.