Fig. 1.
Download original image
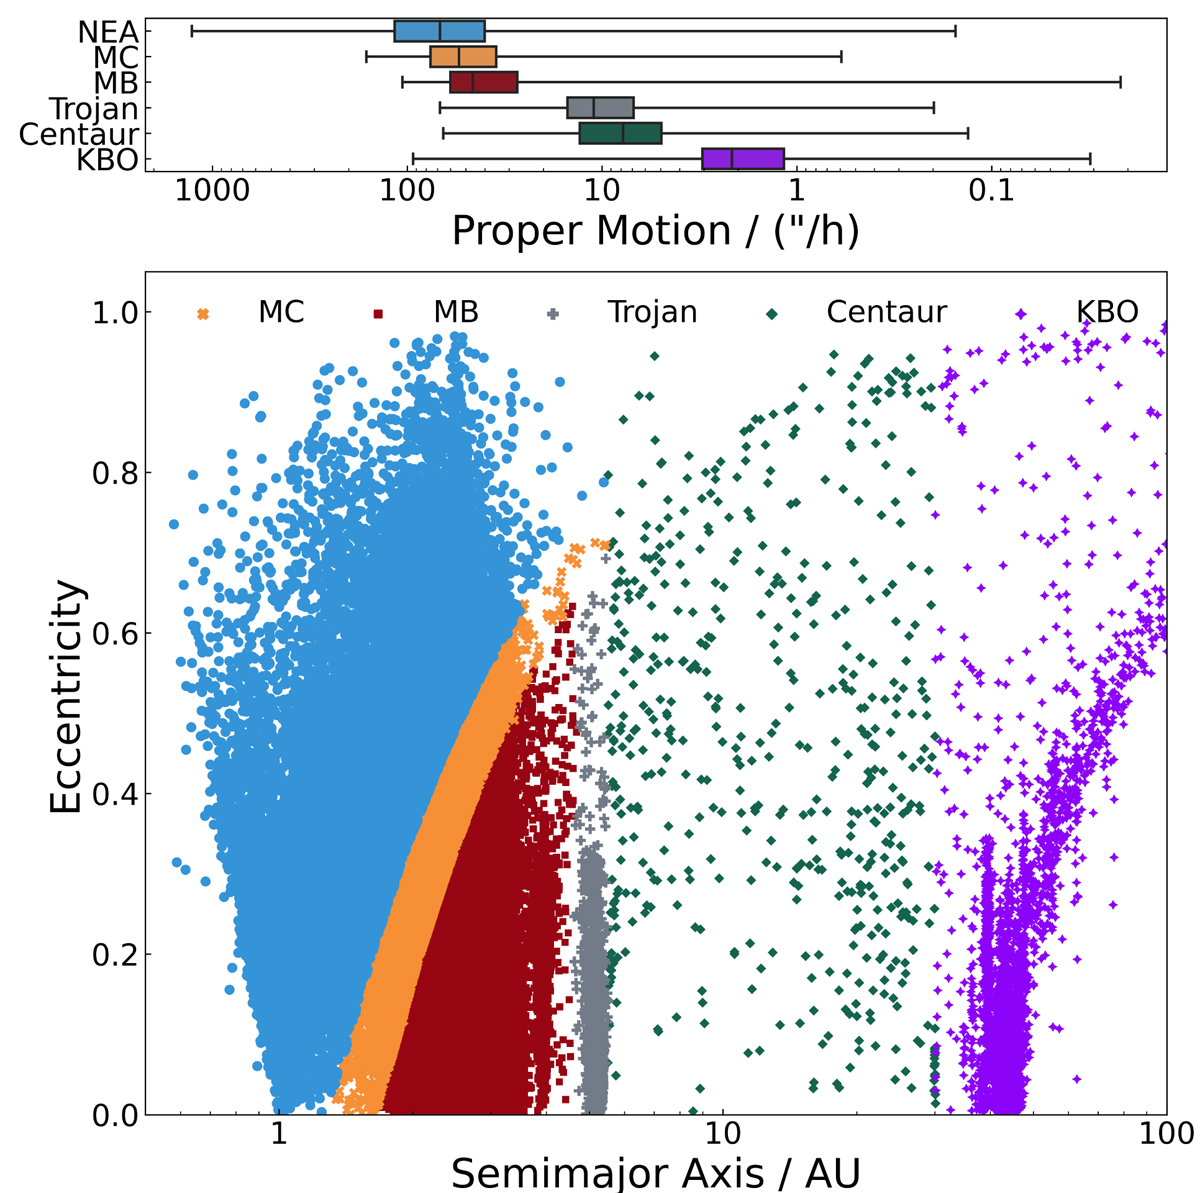
Distribution of asteroid populations in the Solar System is illustrated based on their semi-major axes and eccentricities from the astorb database (lower plot). Upper plot: distribution of the proper motions for the indicated populations (near-Earth asteroids, NEA; Mars-crosser, MC; main belt, MB; Trojans; Centaurs; and Kuiper belt objects, KBO), extracted at a single epoch for all asteroids. The boxplot displays the minimum and maximum values for each population (whiskers), as well as the 25% and 75% quartiles (box edges) and the median proper motion (box center).
Current usage metrics show cumulative count of Article Views (full-text article views including HTML views, PDF and ePub downloads, according to the available data) and Abstracts Views on Vision4Press platform.
Data correspond to usage on the plateform after 2015. The current usage metrics is available 48-96 hours after online publication and is updated daily on week days.
Initial download of the metrics may take a while.