Fig. C.1.
Download original image
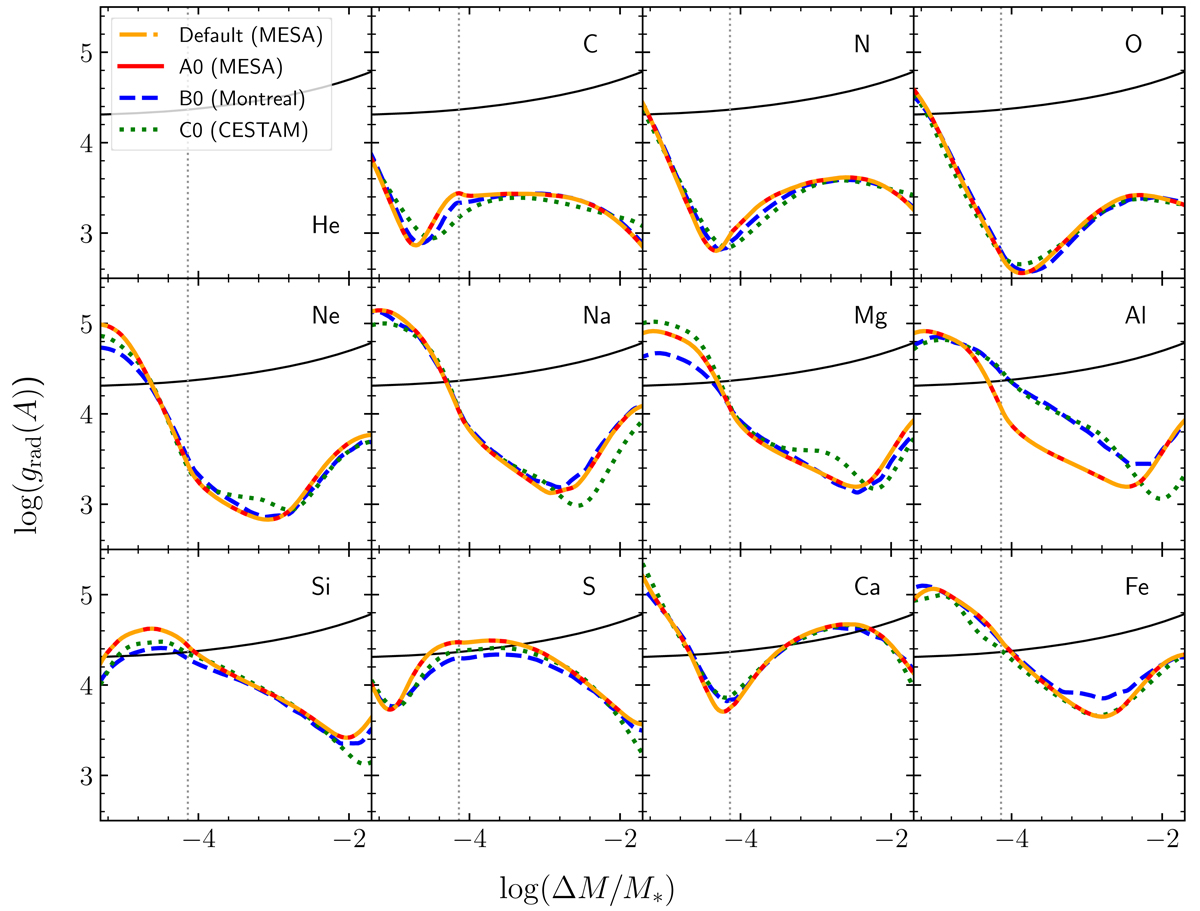
Radiative acceleration profiles according to log(ΔM/M*) (with ΔM being the mass above the radius r) obtained with MESA (A0 model, red solid lines), the Montreal/Montpellier code (B0 model, blue dashed lines) and CESTAM (C0 model, green dotted lines). The black solid line represent the gravity. The vertical grey dotted line represents the average position of the surface convective zone of the three models. The surface is towards the left part of the plots.
Current usage metrics show cumulative count of Article Views (full-text article views including HTML views, PDF and ePub downloads, according to the available data) and Abstracts Views on Vision4Press platform.
Data correspond to usage on the plateform after 2015. The current usage metrics is available 48-96 hours after online publication and is updated daily on week days.
Initial download of the metrics may take a while.