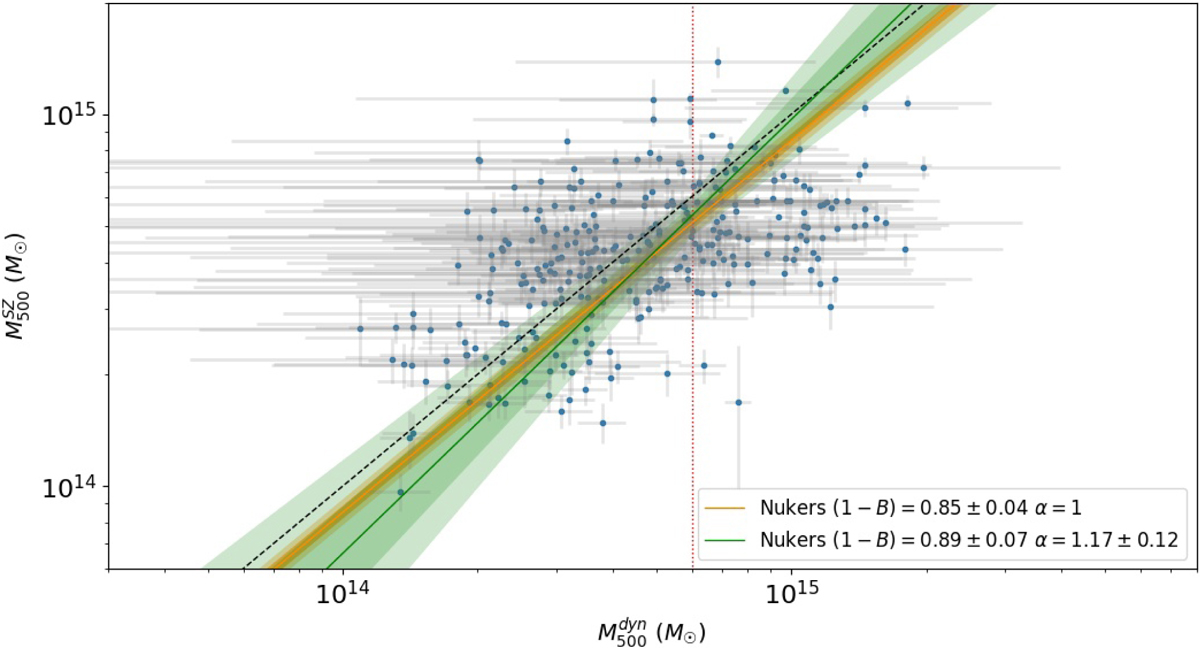
Fig. 4.
Download original image
Scaling relation for the sample of 297 PSZ2 clusters (1.5 × r200 sample). The dashed black line shows the 1 : 1 line. The orange line represents our best fit using the Nukers method with α = 1 (see text for details). The green line is the fit using the complete Nukers method for a free slope. The shaded regions represent the 1- and 2-σ errors of the reconstructed parameters. The vertical red dotted line corresponds to the pivot mass of 6 × 10¹⁴ M⊙.
Current usage metrics show cumulative count of Article Views (full-text article views including HTML views, PDF and ePub downloads, according to the available data) and Abstracts Views on Vision4Press platform.
Data correspond to usage on the plateform after 2015. The current usage metrics is available 48-96 hours after online publication and is updated daily on week days.
Initial download of the metrics may take a while.