Fig. 2.
Download original image
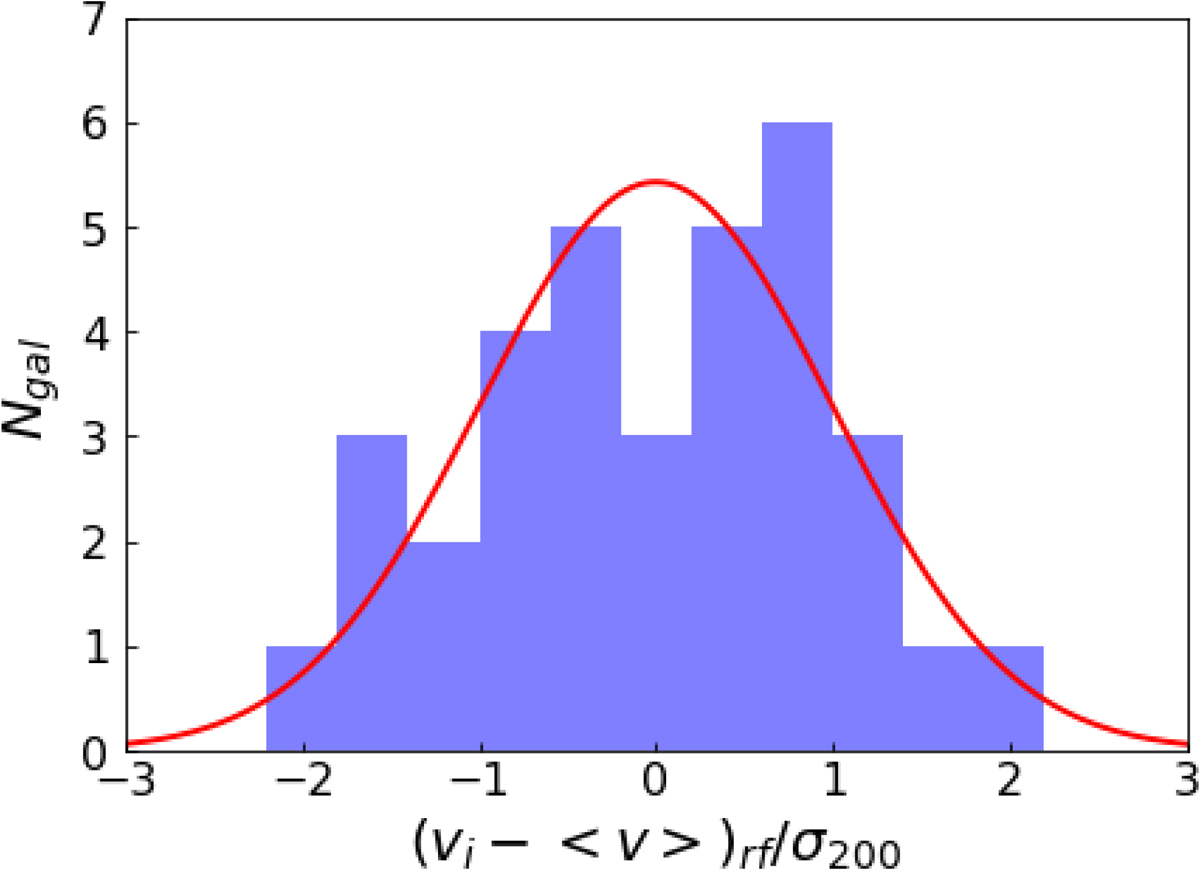
Example of the distribution of galaxies in PSZ2 G009.04+31.09 as a function of the rest frame difference in radial velocity from the mean radial velocity of the cluster. The cluster members used to estimate the velocity dispersion are shown in blue. The red line represents the normal distribution expected for the estimated velocity dispersion of σ200 = 1068 km s−1.
Current usage metrics show cumulative count of Article Views (full-text article views including HTML views, PDF and ePub downloads, according to the available data) and Abstracts Views on Vision4Press platform.
Data correspond to usage on the plateform after 2015. The current usage metrics is available 48-96 hours after online publication and is updated daily on week days.
Initial download of the metrics may take a while.