Free Access
Fig. 8.
Download original image
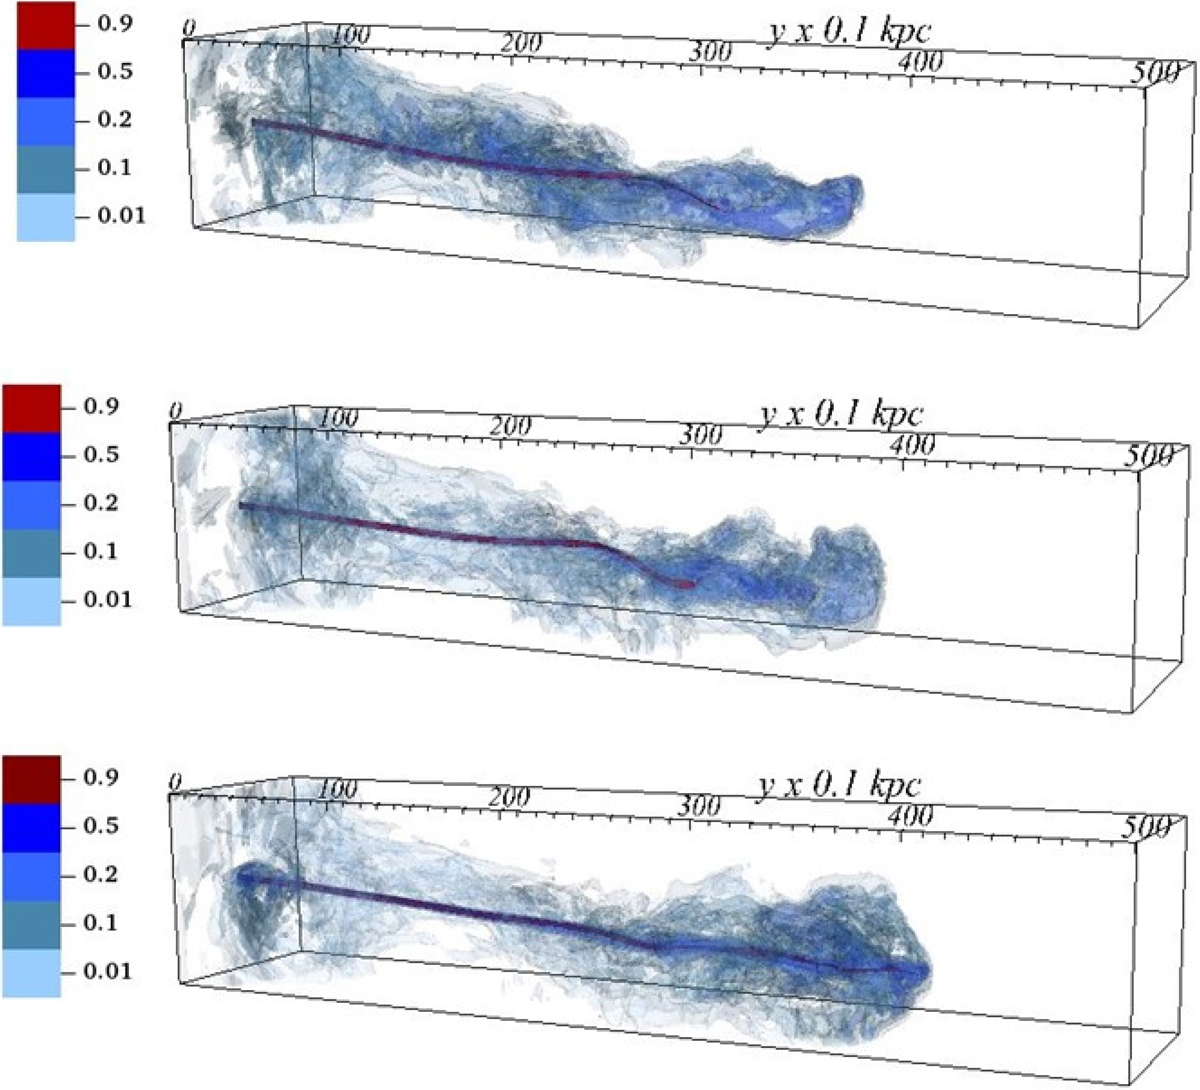
3D isocontours of the tracer distribution for case C1 at three different times, in the top panel t ∼ 3.7 × 10⁷ yr, in the middle panel t ∼ 4.3 × 10⁷ yr and in the bottom panel t ∼ 5.1 × 10⁷ yr.
Current usage metrics show cumulative count of Article Views (full-text article views including HTML views, PDF and ePub downloads, according to the available data) and Abstracts Views on Vision4Press platform.
Data correspond to usage on the plateform after 2015. The current usage metrics is available 48-96 hours after online publication and is updated daily on week days.
Initial download of the metrics may take a while.