Free Access
Fig. 1.
Download original image
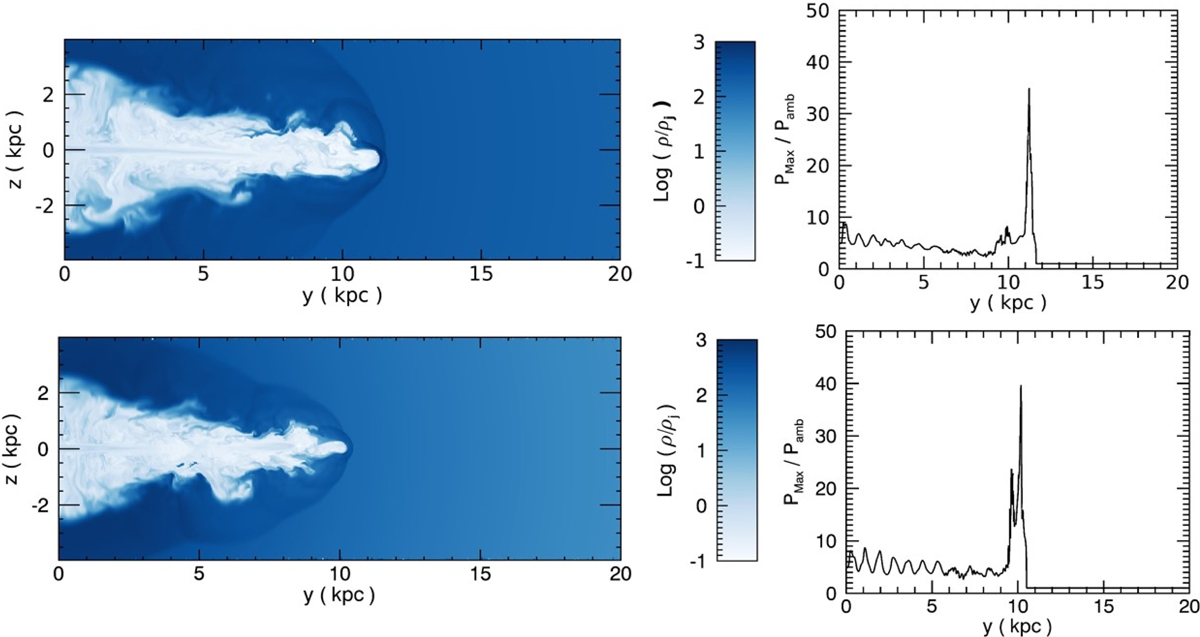
Top: cut of the logarithmic density distribution for case A1 in the (y, z) plane (left panel) and maximum gas pressure as a function of y (right panel) at the time t = 1.9 × 10⁷ yr. Bottom: same as for case A2, but at the time t = 1.3 × 10⁷ yr.
Current usage metrics show cumulative count of Article Views (full-text article views including HTML views, PDF and ePub downloads, according to the available data) and Abstracts Views on Vision4Press platform.
Data correspond to usage on the plateform after 2015. The current usage metrics is available 48-96 hours after online publication and is updated daily on week days.
Initial download of the metrics may take a while.