Fig. 6
Download original image
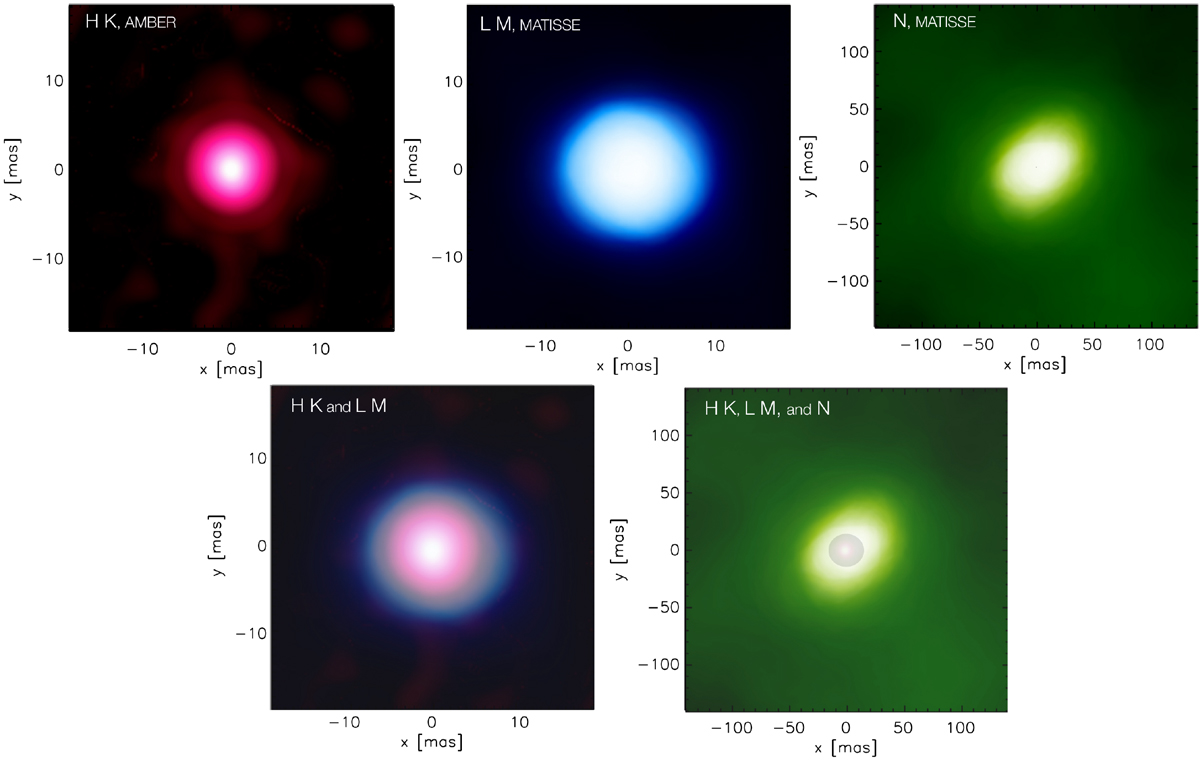
Top row: colour composite images in the H and K bands (observation taken in 2008 with the AMBER instrument, with 21 spectral channels combined, Chiavassa et al. 2010), L and M (31 spectral channels from Fig. 4 combined), and N band (17 spectral channels from Fig. 5 combined). Bottom row, left panel: colour composite images for the H − K (pink scale) and L − M (blue scale) bands. Bottom row, right panel: all the bands, including N (green scale), are combined. The photospheric structures (H to M bands) are located in the centre of the N band maps.
Current usage metrics show cumulative count of Article Views (full-text article views including HTML views, PDF and ePub downloads, according to the available data) and Abstracts Views on Vision4Press platform.
Data correspond to usage on the plateform after 2015. The current usage metrics is available 48-96 hours after online publication and is updated daily on week days.
Initial download of the metrics may take a while.