Fig. 4
Download original image
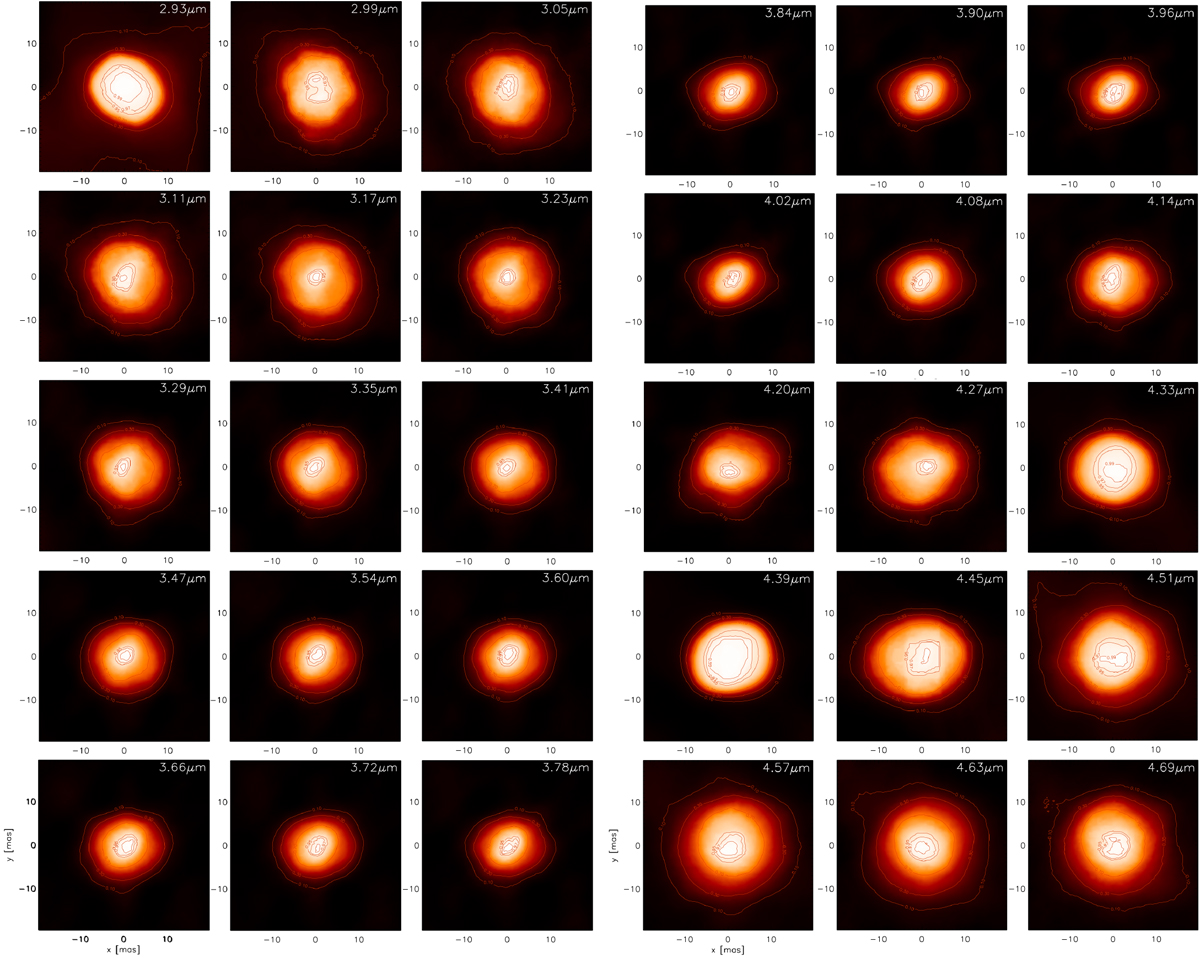
Reconstructed images in L and M bands. They have 256 × 256 pixels with 0.39 mas pixel−1 and are convolved with the interferometric beam (Fig. 1). The peak intensity is normalised between [0, 1], and the corresponding noise maps are shown in Fig. A.1. The highest noise value is ~ 1.5 × 10⁻⁴. The contour lines correspond to [0.10, 0.30, 0.70, 0.95, 0.97, 0.99]. East is to the left, and north is up. As reported in Sect. 2.2, the data quality of the images at wavelengths lower than ~3.3 μm and between 4.0 and 4.7 μm is compromised by the telluric spectrum at the observing site.
Current usage metrics show cumulative count of Article Views (full-text article views including HTML views, PDF and ePub downloads, according to the available data) and Abstracts Views on Vision4Press platform.
Data correspond to usage on the plateform after 2015. The current usage metrics is available 48-96 hours after online publication and is updated daily on week days.
Initial download of the metrics may take a while.