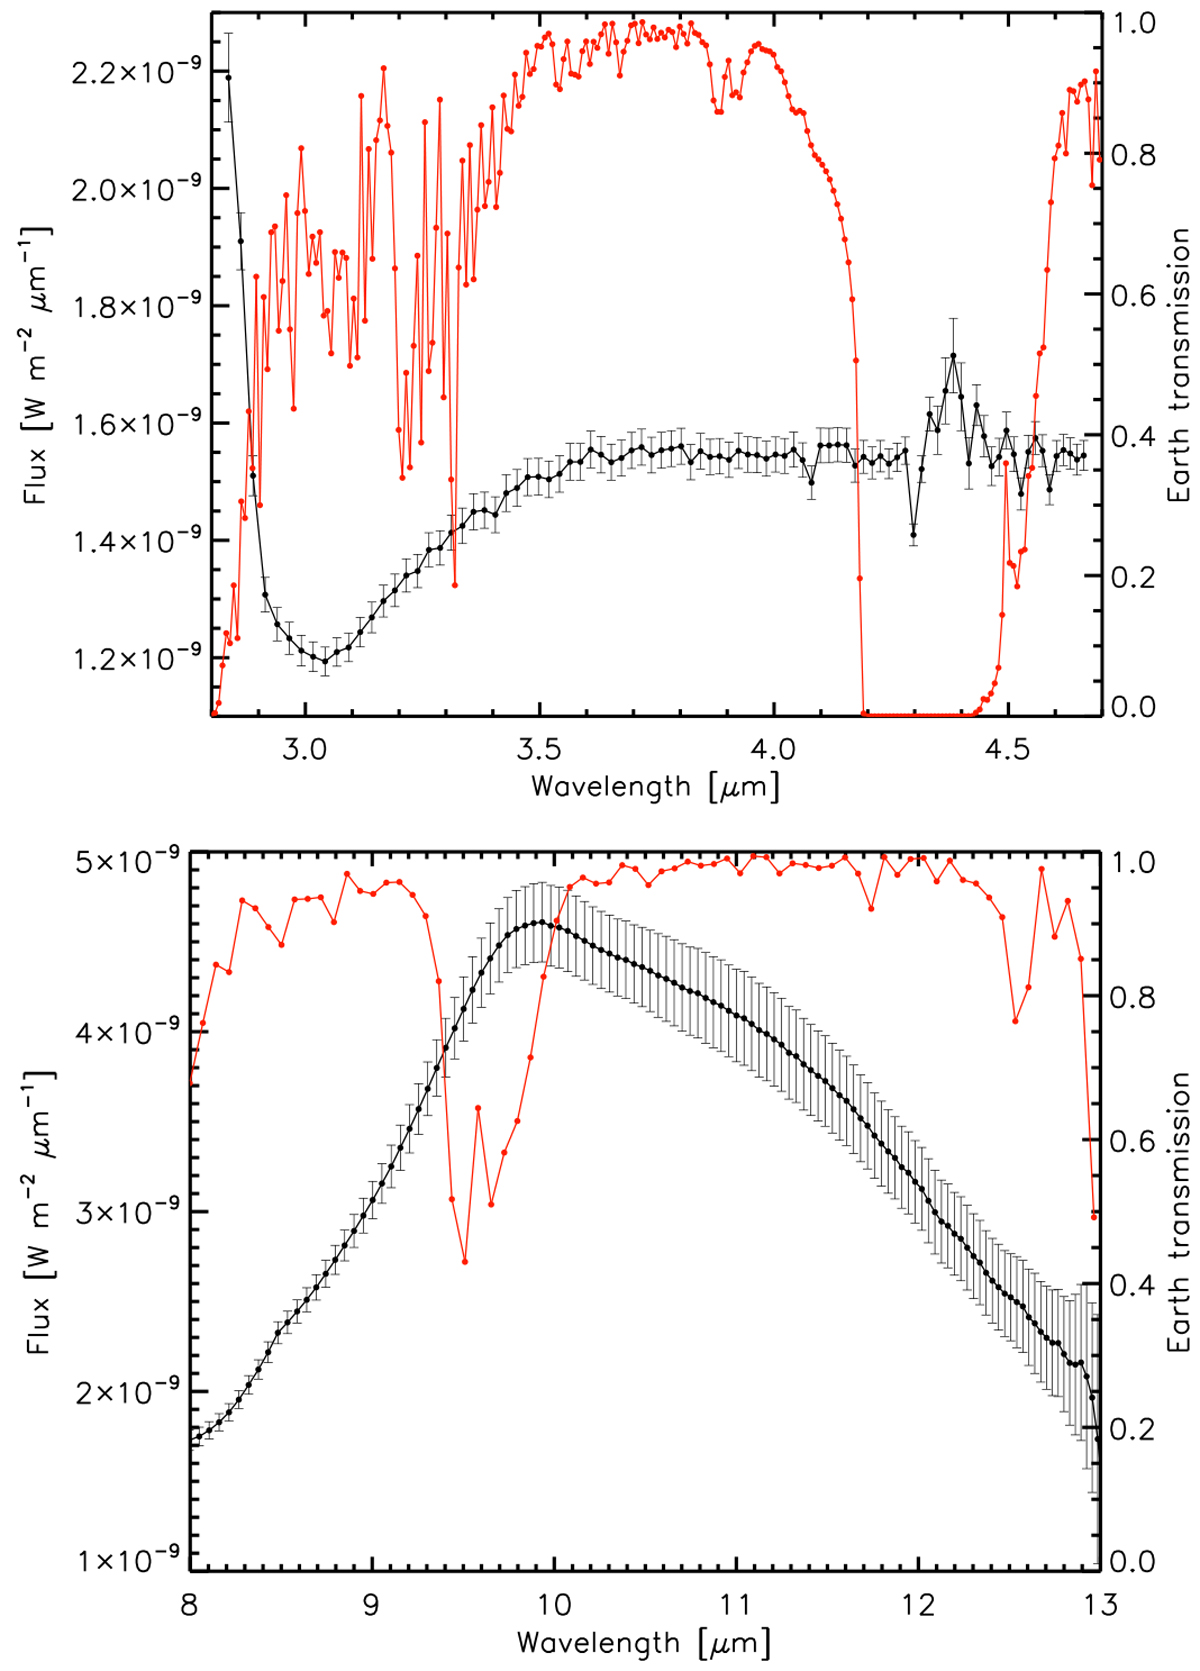
Fig. 3
Download original image
Black curve: representative example of calibrated MATISSE flux of VX Sgr (see Sect. 2.2) in L and M bands (top) and N band (low) overplotted to the telluric spectrum at the observing site (red) computed with the ESO Skycalc web application and sampled to the same resolving power of the MATISSE observations. The night shown in this plot is 25 June 2019.
Current usage metrics show cumulative count of Article Views (full-text article views including HTML views, PDF and ePub downloads, according to the available data) and Abstracts Views on Vision4Press platform.
Data correspond to usage on the plateform after 2015. The current usage metrics is available 48-96 hours after online publication and is updated daily on week days.
Initial download of the metrics may take a while.