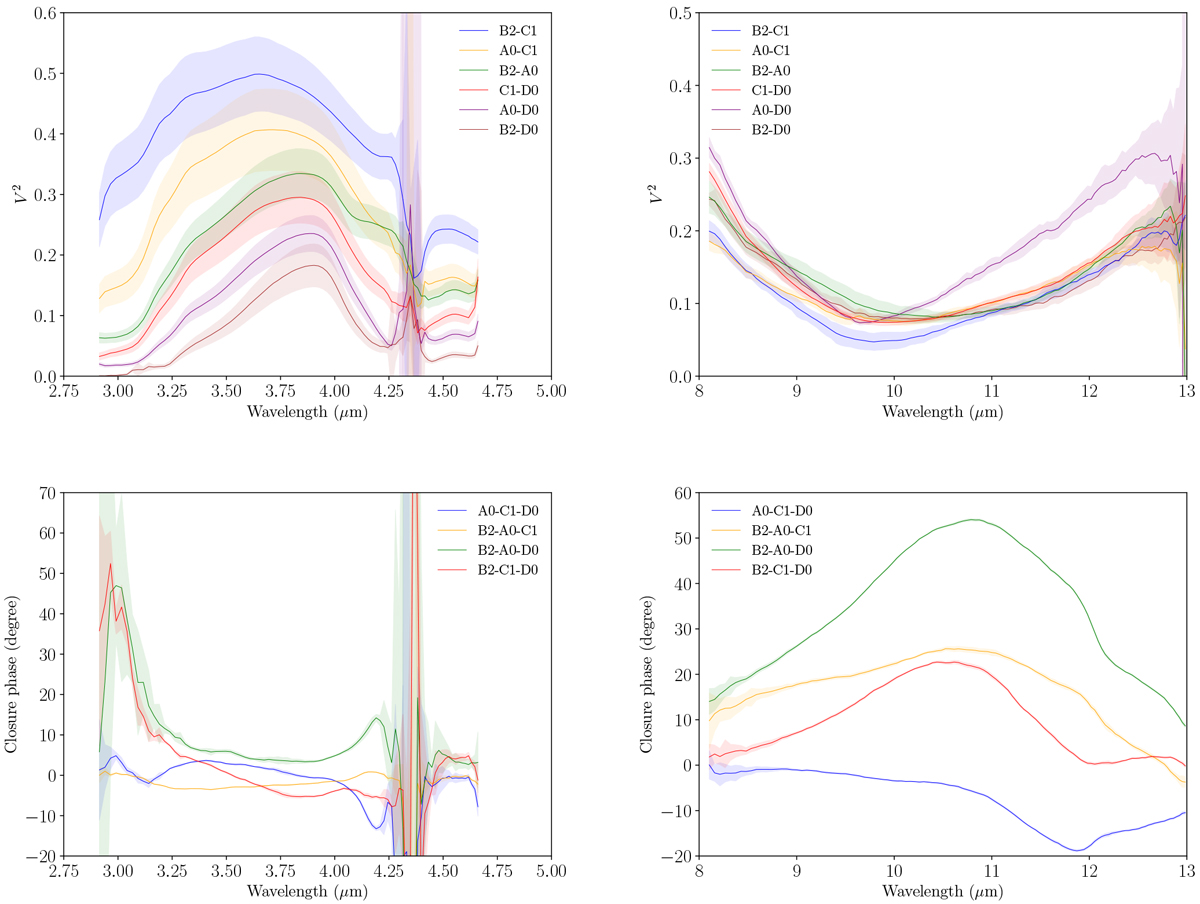
Fig. 2
Download original image
Representative example of visibility amplitudes (top panels) and closure phases (bottom panels) for the L and M bands (left column) and the N band (right column). The different colours indicate different baselines for visibilities and triplets for closures phases. The spectral region between 4.27 and 4.44 μm suffers from noise due to the telluric lines in this range. The night shown in this plot is 25 June 2019, as in Fig. 3.
Current usage metrics show cumulative count of Article Views (full-text article views including HTML views, PDF and ePub downloads, according to the available data) and Abstracts Views on Vision4Press platform.
Data correspond to usage on the plateform after 2015. The current usage metrics is available 48-96 hours after online publication and is updated daily on week days.
Initial download of the metrics may take a while.